A common way to assess cycling fitness is through the use of Functional Threshold Power (FTP) testing, but Critical Power is an increasingly popular way to assess a rider’s strengths and weaknesses, as well as set training zones.
FTP is commonly defined as the highest average power you can sustain for approximately an hour, measured in watts. Your FTP is usually estimated through a shorter effort, normally a 20-minute FTP test or a ramp test protocol.
As a single figure, it’s relatively easy to understand and numerous indoor cycling apps offer ready-made FTP tests and will calculate your training zones using the result.
However, FTP testing has several limitations, including a lack of accuracy when using shorter test durations, the inability to understand the adaptations that have contributed to changes in fitness and a lack of relevance to some cycling disciplines. It can also be difficult to apply population averages on an individual level.
As an alternative method for assessing cycling fitness, the Critical Power test can overcome many of the shortcomings of FTP testing and provide a more complete picture of your physiological ability as a rider.
But what is Critical Power, what are the benefits of using Critical Power, how can you do a CP test and what can you do with the results?
What is Critical Power?
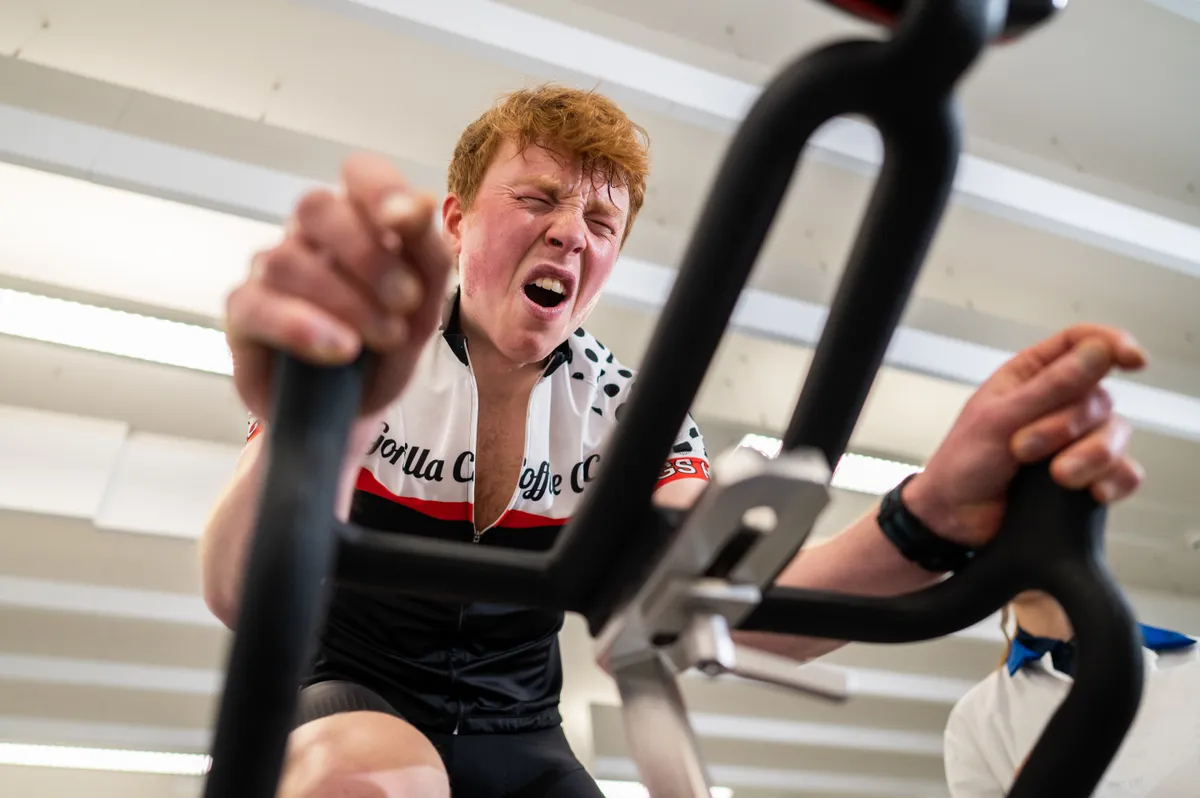
Critical Power testing is borne from the principle that power output above a certain ‘critical power’ follows a well-defined ‘hyperbolic’ power-duration curve as explained below.
The curve can be defined by two variables: Critical Power (CP) and W’ (pronounced ‘W prime’).
CP is the power output you’ll tend towards when riding at a high intensity, typically for around 30 to 40 minutes.
W' is the amount of work (measured in units of energy or kJ) you can expend above the CP before you reach complete exhaustion.
Similar to FTP, Critical Power provides an indication of your maximum sustainable power over an extended period of time.
CP will generally be slightly higher than FTP (studies suggest around 9 per cent higher on average, although in my experience as a coach it’s typically slightly less, around 4 to 5 per cent) but both can be interpreted in a similar way.
Like FTP, a higher CP will generally mean you can hold a higher power during endurance cycling disciplines, so it’s a useful fitness benchmark for many cyclists.

W' represents your capacity to ride above your CP. Having a larger W' is most important for short events performed above the Critical Power (such as short hill climbs), and for punchy disciplines such as criterium, cyclocross and cross-country mountain bike racing, which require frequent efforts above CP within a longer race.
W' is sometimes referred to as ‘anaerobic capacity’ and, while this isn’t strictly a correct interpretation, it can still be a useful generalisation to keep in mind to help make sense of your data.
By completing several maximal efforts, you can determine your own CP and W' values. We’ll cover how' to complete a Critical Power test, but first let’s take a closer look at the benefits.
Benefits of Critical Power testing
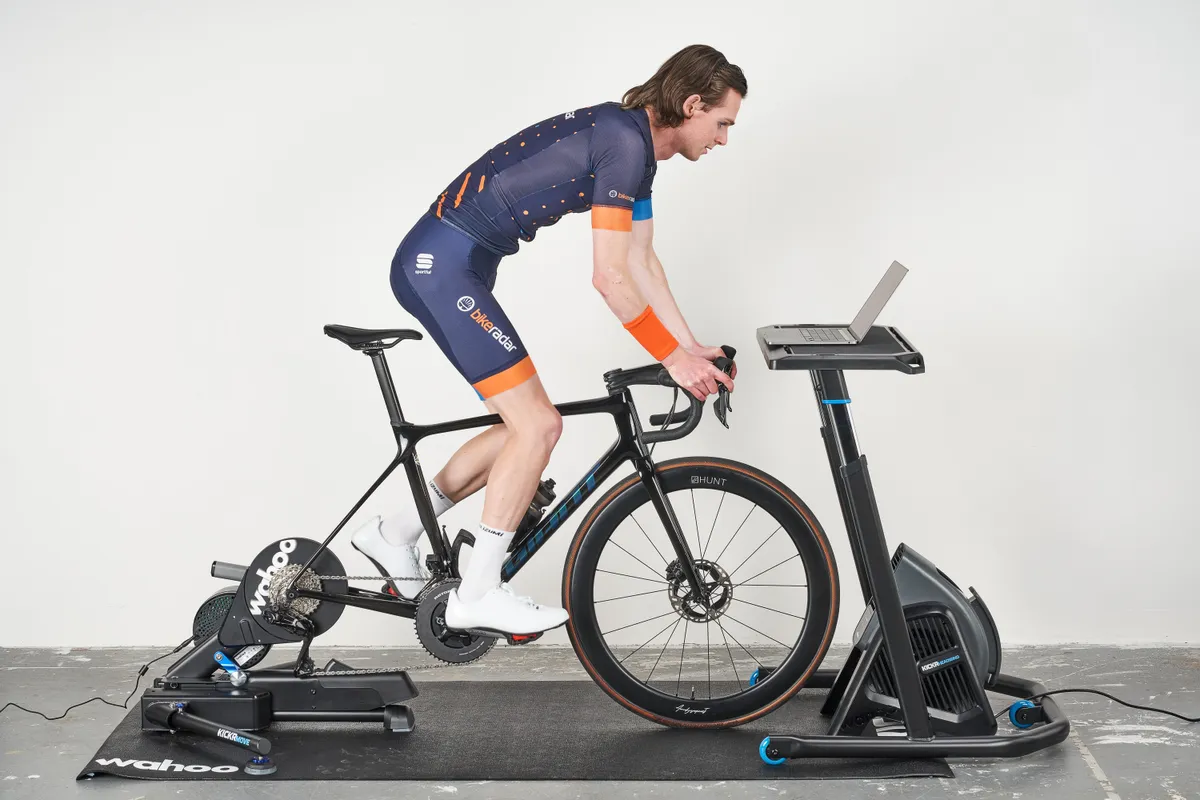
Critical Power offers a more comprehensive picture of your physiology by providing data on both your maximum sustainable power and your capacity above this power.
As a result, Critical Power testing is more widely applicable across a variety of disciplines and can help you to better identify key strengths, as well as specific areas to work on.
Compared to FTP testing methods, CP testing also has greater validity, since it relies on fewer assumptions about your physiology and how energy is generated during a test.

For example, some cyclists will be more aerobically strong, and others more anaerobically dominant. CP helps to reveal what this balance is on an individual basis, unlike FTP as a single figure.
This is particularly useful if you’re an outlier from the ‘norm’, where FTP estimates can be as much as 10 to 15 per cent out at an individual level.
Once you know your CP and W', you can also use the relationship between these variables to estimate the specific power you can hold over a given duration. This is particularly helpful if you’re looking to figure out how to pace race or training efforts, or to set accurate intensity targets.
Disadvantages of Critical Power testing
CP testing is not without its limitations.
First of all, it requires at least two maximal efforts, so can be a little more time-consuming than some FTP tests. Plus, you’ll either have to do a bit of maths to calculate your CP and W' values or use an online tool to do the calculations for you.

Like with most testing methods, your results will be subject to your performance on the day, which can be impacted by numerous factors such as motivation, fatigue, fuelling, hydration status, and so on.
While more information can be gleaned from a CP test than an FTP test, it still can’t tell you everything. For example, if your W' goes up, it can be unclear whether this is due to an increase in your ability to produce energy anaerobically (without oxygen), or whether it represents an improvement in your aerobic fitness (e.g. VO2 max).
To get this level of insight, you may need additional data from a laboratory, but Critical Power offers an effective means of field testing for everyday riders who don’t have access to a lab. You'll only need a power meter on your bike or smart trainer.
How to do a Critical Power test

There are various methods for testing Critical Power. Here we’ll run through a two-test method and a more complex four-test method.
Two-test method
One validated method is to complete a three-minute and 12-minute maximal effort.
These efforts can be performed on separate days (after a thorough warm-up), or within the same session, separated by at least 30 to 40 minutes of rest or gentle riding.
The efforts should be paced, with the aim of power output being as consistent as possible across each effort.
Once complete, CP and W' can be calculated using the following equations:
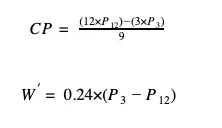
P³ is the average power over the three-minute effort, and P¹² is the power output over the 12-minute effort.
If that looks complicated, here’s a step-by-step guide to doing your own calculation:
Calculating Critical Power
- Multiply the average power you held over 12-mins by 12
- Multiply the average power you held over 3-mins by 3
- Subtract the number calculated in step (2) from the number calculated in step (1)
- Divide the number calculated in step (3) by 9. This is your Critical Power
Calculating W’
- Subtract the average power held over 12-minutes from the average power held over 3-minutes
- Multiply the number calculated in step (1) by 0.24. This is your W’.
The first couple of times you do this testing, your results might be impacted by imperfect pacing, but with some familiarisation, you should be able to achieve reliable results and start tracking changes in your fitness with more confidence.
Four-test method
To get more accurate CP and W’ estimates, you can include one or two additional maximal efforts in your calculation. Adding more test efforts means any sub-par performances will have less influence on your CP and W’ values.
These efforts can last anywhere from three minutes to around 20 minutes, but we’d recommend adding a five-minute effort and (optionally) a 20-minute effort to the three and 12-minute efforts described above.
These additional efforts should be done on separate days from your original test. To find your CP and W’ values using this method, you can use an online Critical Power calculator.
How to use your Critical Power results
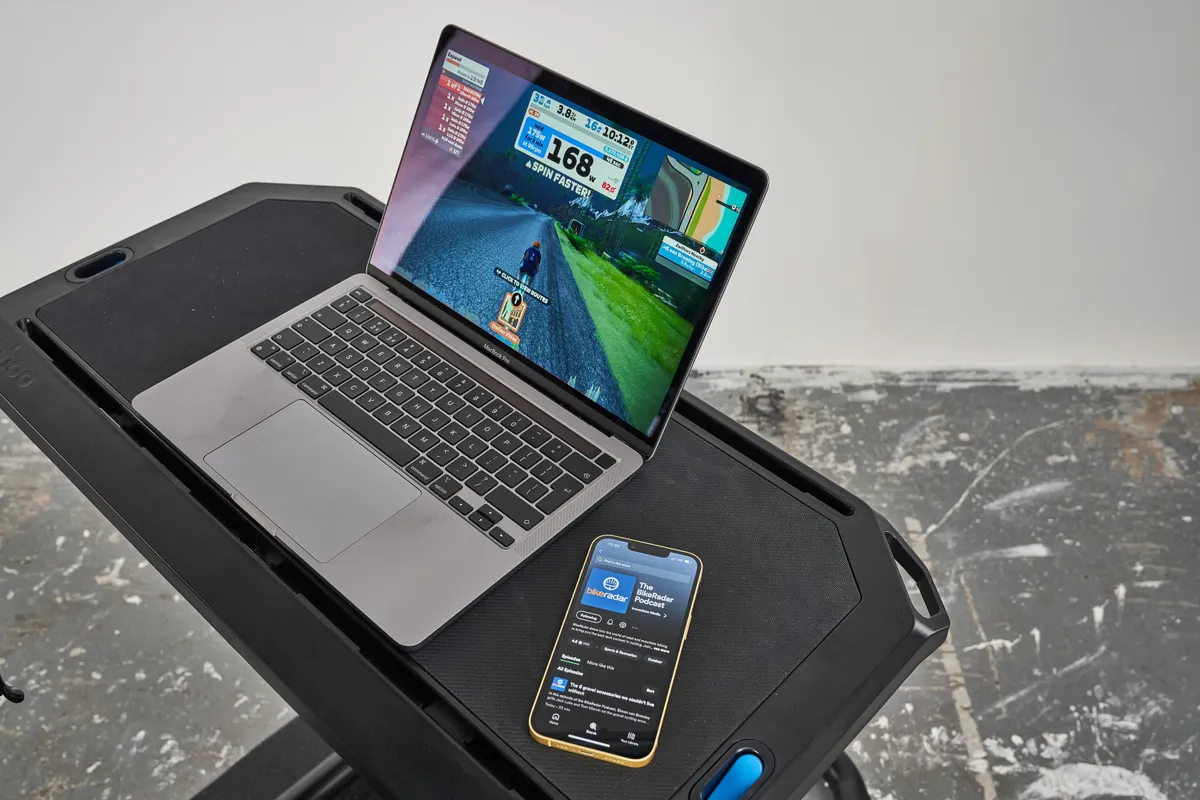
There are a number of ways that Critical Power data can be used to inform your training, including identifying your weaknesses as a rider, monitoring your training progress, setting training zones and pacing an effort.
Identify your weaknesses
Compared to FTP, Critical Power can help give a better idea of the size of your aerobic and anaerobic capacities, and thus help you understand which of these you may need to work on most.
Although not always true, a larger W’ will generally indicate a bigger ‘anaerobic capacity’ – or, in other words, a greater ability to produce and sustain power through anaerobic systems (without oxygen).
It’s not possible to give generalised benchmarks for what a ‘high’, ‘medium’ or ‘low’ W’ is because this depends on how well-developed your aerobic fitness (or VO2 max) is, as well as other factors such as gender and muscle mass.
However, for a moderately trained male endurance cyclist of average body weight, completing around 8 to 10 hours of training per week, an optimum W’ would be around 16 to 20kJ.
Very well-trained male cyclists do well with W’ values in the low to mid 20s. For females, optimal W’ values are around 11 to 15kJ for moderately trained and 14 to 18kJ for well-trained cyclists.

More steady-state disciplines, such as sportives and gran fondos will benefit from W’ values at the lower end of the ranges above, whereas punchier disciplines such as criteriums, cyclocross and cross-country MTB will benefit from W’ values at the higher end.
However, if you build your W’ too far, then this can come at the expense of your endurance and threshold power. Thus, only cyclists competing in short events such as track sprints or short hill climbs will want to build their W’ much beyond the ranges above.
If your W’ is already in the right range or is a little too high, you’d likely benefit from focusing mainly on building your aerobic fitness and, subsequently, your CP figure.
Monitor your progress
Critical Power testing can be used to understand how your fitness is changing. We’d recommend testing your CP and W’ every 12 weeks or so to evaluate whether your training is having the desired effect and your fitness is progressing in the right way for your training goals.
Set training zones
Training zones are commonly defined based on percentages of FTP, typically with 5-7 zones, with a common six-zone system developed by Dr Andrew Coggan shown below:
| Zone | Name | Heart rate (% of threshold HR) | Power (% of threshold power) | Typical duration |
|---|---|---|---|---|
| 1 | Active recovery | Less than 68% | Less than 55% | n/a |
| 2 | Endurance | 69-83% | 56-75% | 3+ hours |
| 3 | Tempo / Sweetspot | 84-94% | 76-90% | 20 mins to 1 hour |
| 4 | Threshold | 95-105% | 91-105% | 10 to 30 mins |
| 5 | VO2 max | More than 106% | 106-120% | 3 to 8 mins |
| 6 | Anaerobic capacity | n/a | More than 121% | 30 seconds to 3 mins |
Critical power is not the same as FTP, but can be used to estimate your training zones. If using the zones above, take 94 per cent of your Critical Power to replace FTP, then apply the percentages to find your values for each zone.
As with FTP, you’ll need to pay attention to your rating of perceived exertion in training to determine whether your workouts are manageable.
This is particularly true for zones five and six (i.e. zones above the threshold), where there can be a lot of variability in the ‘optimal’ training intensity from one rider to another, irrespective of FTP/CP.
Pace an effort

Critical Power testing can help you estimate the power you can hold for a given duration… or vice versa. This is valuable if you're racing hill climbs, for example.
This only applies to power outputs above your Critical Power and for durations between around three to 20 minutes but is still very useful for pacing shorter efforts or setting interval targets.
Again, a bit of maths is needed to work these out. The equations are shown here or, once again, you can use an online Critical Power calculator.
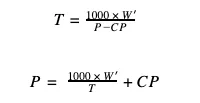
P = power in watts, T = time in seconds, CP = critical power in Watts, W’ = ‘W prime’ in kJ.
Relationship with other power-duration models
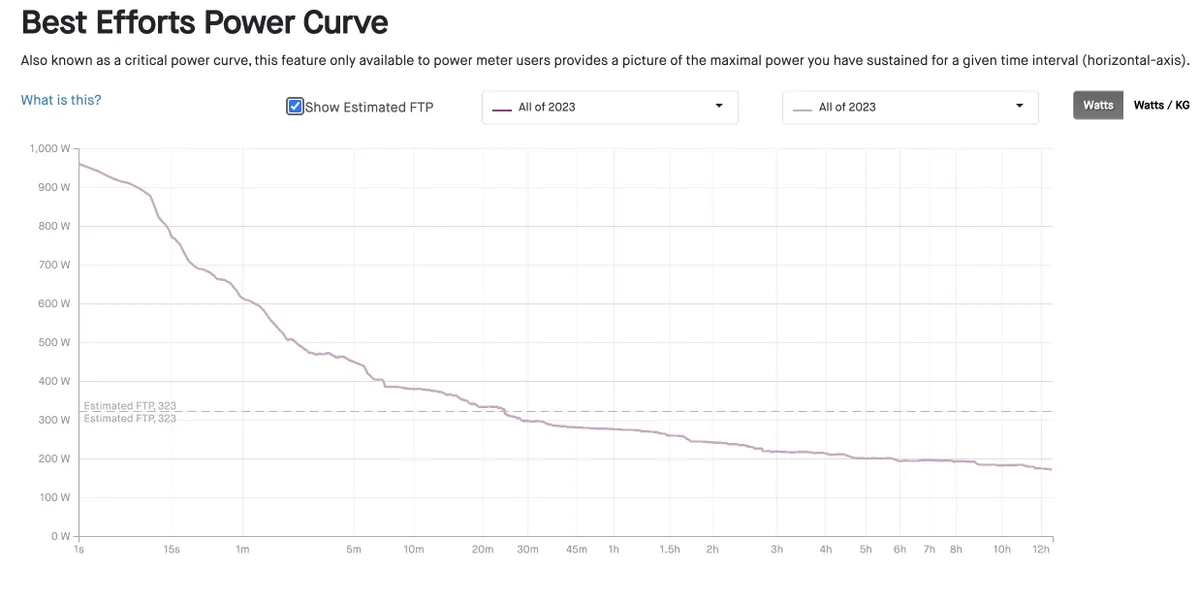
Finally, you may be wondering how the Critical Power model differs from other power curves you may be familiar with, such as those available through Strava.
Like the Critical Power model, these power curves can also be used to spot strengths and limiters. They compare your watts per kilo or power-to-weight ratio to ‘typical’ values across a variety of durations and estimate how to pace different efforts (provided that your power curves include a good number of maximal or near-maximal efforts).
The key difference is that Critical Power goes one step further. It uses the specific shape of your power curve (e.g. how high the power is, and the rate at which the power drops off) to calculate fitness parameters that you can use to better understand your fitness profile and how this is changing over time.
In effect, the Critical Power model distils a complex power curve that’s quite hard to interpret into a set of parameters that are much easier to interpret and compare over time.
All things considered, the Critical Power testing method offers benefits beyond basic FTP testing from the perspective of being more scientifically valid and providing greater insight into your energy system strengths. The trade-off is that it takes that little bit of extra work on your part.
If you’re looking to understand your wider physiology to a greater extent than the single number provided by FTP testing, while still using a field-based method, then Critical Power represents a good alternative for dedicated riders.
If, on the other hand, you’re looking for a simple metric to guide your training, FTP remains a commonly used option for good reason.

