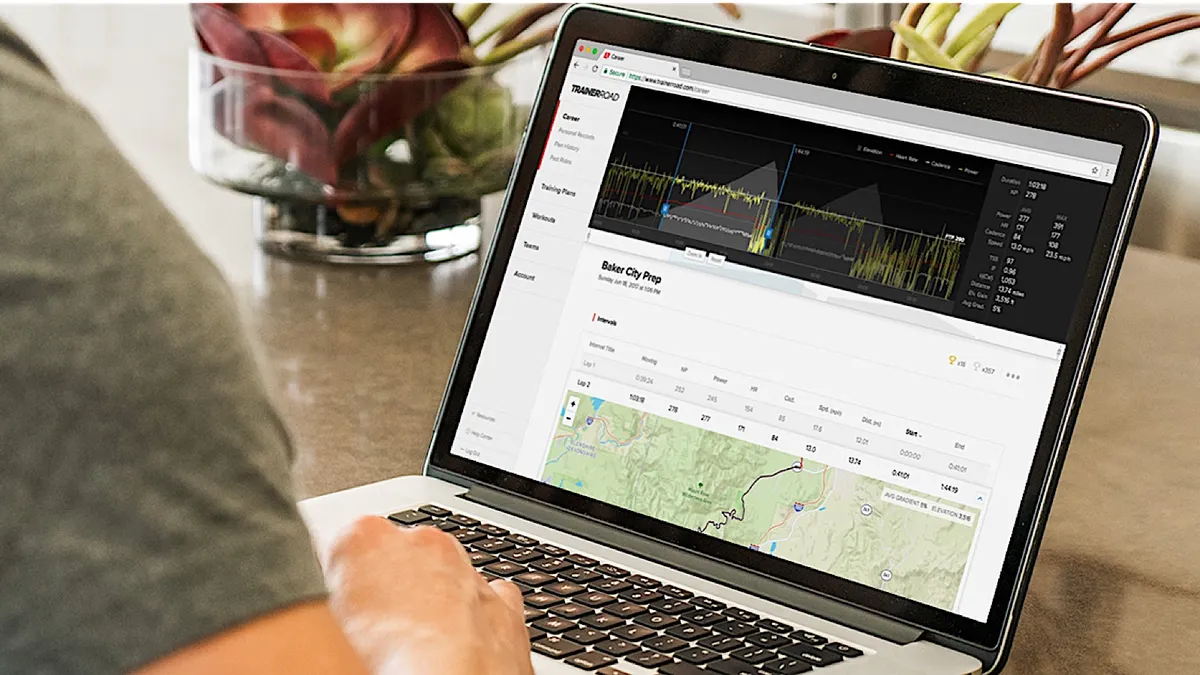

For years, TrainerRoad's bread and butter has been delivering power-based workouts and training plans for indoor training. Now, the company has launched Performance Analytics to help riders see exactly how their training is working, with a focus on simplicity and results. The move puts TrainerRoad in indirect competition with the likes of TrainingPeaks and Today's Plan, which offer detailed analysis at the micro and macro levels centered around performing well at target events.
- TrainerRoad review (5 stars)
- The best smart trainers of 2018
- What is FTP for cycling and why it matters
Performance Analytics — what and why
"The majority of cycling training analytics platforms are too bloated, too hard to use and are missing some key features," said TrainerRoad communications director Jonathan Lee. "We wanted to make a subset of analytic tools that we thought were the important ones to make you faster; then we got rid of the rest. So you'll see that we're missing a lot of metrics that you might see on other sites. We did this by design because we couldn't figure out how to leverage them to get faster."
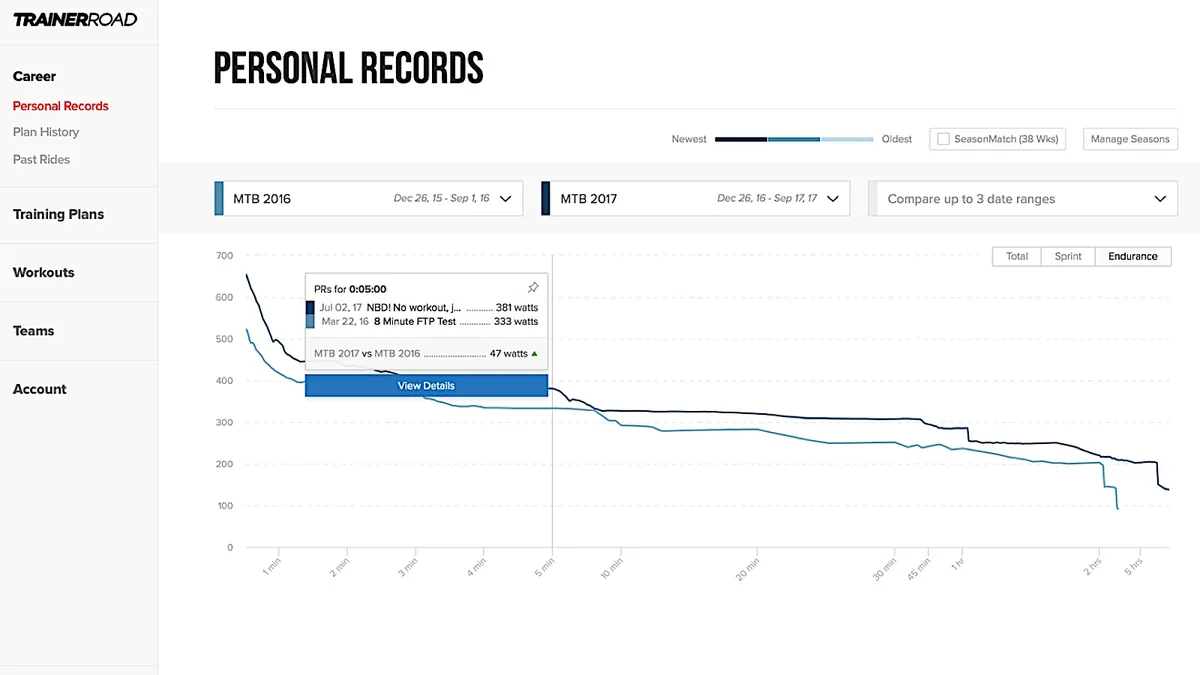
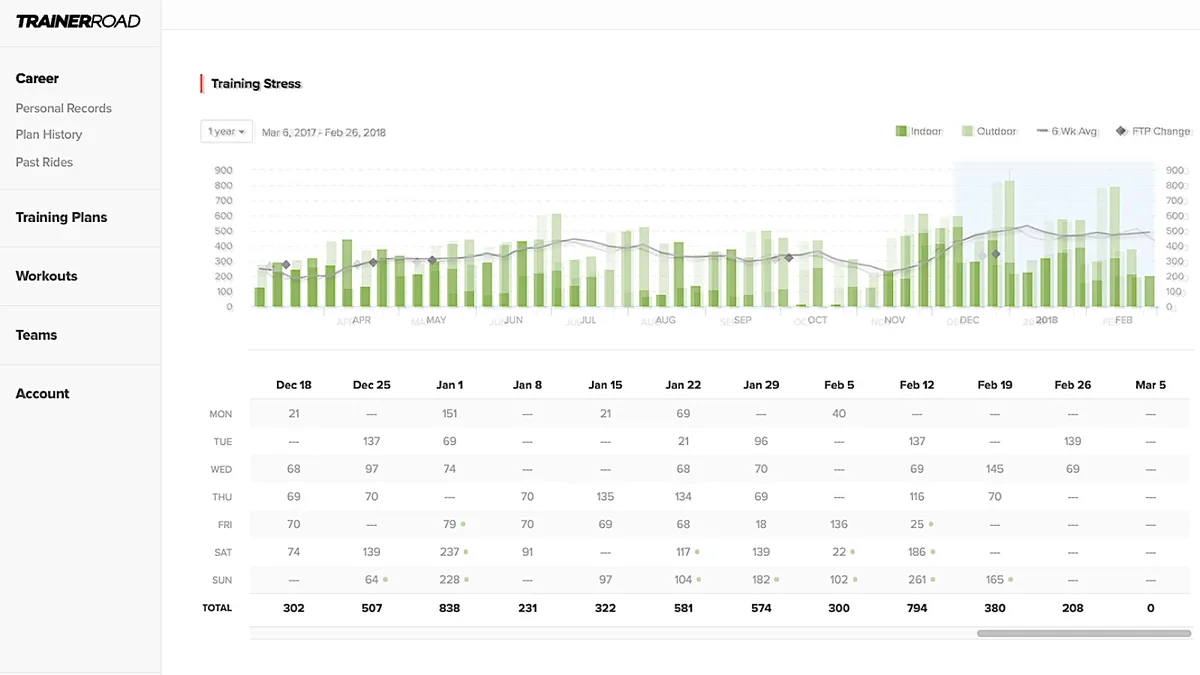
So, for example, there is no left/right analysis, nor rolling tallies of chronic fatigue or acute fatigue. But there are ways to display personal records for customizable periods and compare them to past periods. And there is a fairly straightforward training stress chart that shows cumulative training load. And in all cases, clicking into specific rides for the details is easy.
Perhaps best of all is how the data gets there — TrainerRoad automatically imports your training data from the major sites such as Strava and Garmin Connect once you have paired them.
The training stress chart color-codes indoor and outdoor rides — the company's goal here is to show how specific training can deliver results.
TrainerRoad's simplicity — expanded
While Zwift has blown up indoor training with the 'gamification' of indoor riding, TrainerRoad has stayed its course with power-based workouts. The interface is simple and clean, with targets and actual numbers for power, cadence and heart rate over time.
The company has used the same minimalist approach for Performance Analytics.
"We try to stay focused on normalized and average power, rather than going into the minutiae of creating our own metrics," Lee said. "We keep it down to two things: PRs and training stress. When developing this, we had one question — does this [metric] tell us if we are getting faster or not? If not, we cut it. That is how we arrived at the simplified version."
Performance Analytics — what it doesn't do
Although your rides automatically upload from Strava or Garmin Connect, you need to have a power meter running for the data to be useful. Unlike TrainingPeaks and Today's plan, which can estimate training stress from heart rate, Performance Analytics does not. Instead, the software prompts you to estimate training stress based on duration and rate of perceived exertion from a drop-down menu.
TrainerRoad has included the Performance Analytics as part of its monthly fee, which includes training plans as well as a deep menu of a la carte workouts. Lee says TrainerRoad now has "millions and millions" of workouts uploaded from 180 countries.
What to do with PRs
The point of the new software, Lee said, is just to help people get faster for their target events by seeing if their training is working.
"If people just focus on their one-hour power or 15-minute power, you might be missing the boat," Lee said. "Performance Anlaytics tells you if you are trending in the right direction for the event you are training for. Say you are doing Leadville, with really long climbs. If I see I am improving at short stuff but not the long stuff, then I could adjust my training."
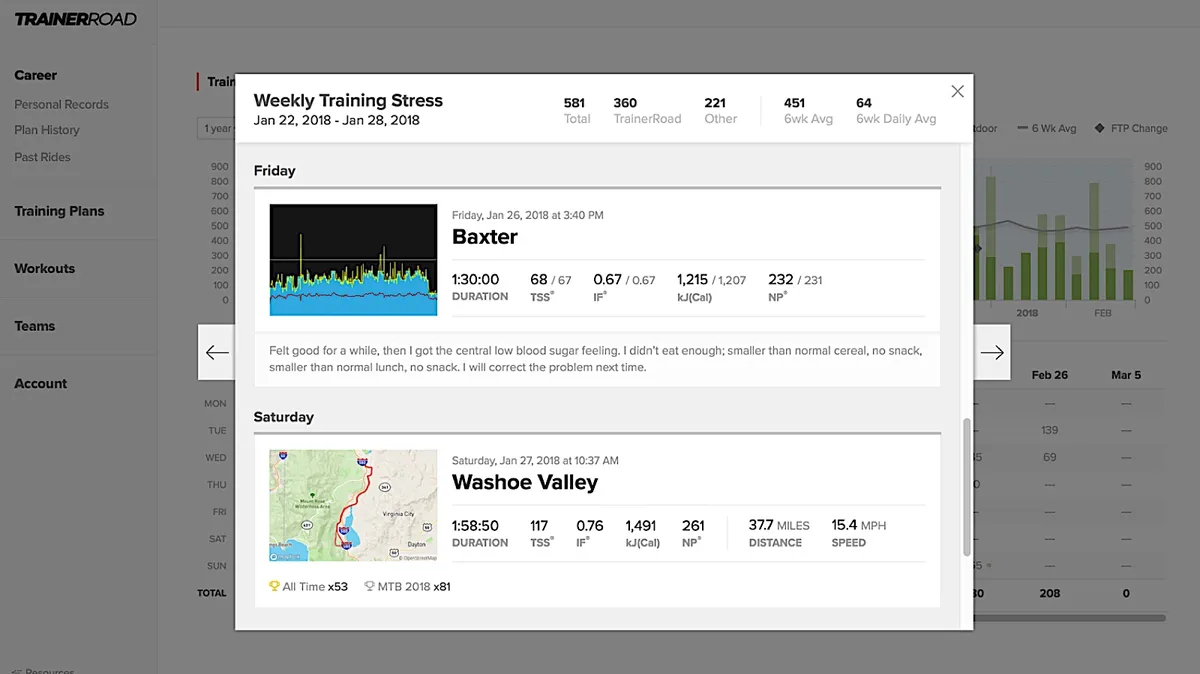
As for the split of indoor and outdoor training, Lee says people almost always see more PRs with indoor training. It's not the fact of being inside, of course, so much as the structured training aspect.
,
"Structured, higher quality training results in better performance," Lee said. "That has always been an assumption on our end that we were confident on, but now folks can see it for themselves."