This article contains paid-for product placement by Hunt Wheels.
Plus-size tyres (2.8–3.0in wide) were hailed by many as the future of mountain biking. They were claimed to have more grip, a smoother ride, and faster rolling-speeds on bumpy terrain — because less energy was lost to vibration.
The odd thing is, I found the bold claims made by “big tyre” advocates to be largely true. When I tested 3in plus tyres on 650b wheels against 2.3in tyres on 29in wheels, the fatter tyres were faster everywhere I tested aside from tarmac.
Nevertheless, plus was a flop. The few available options punctured easily, were expensive to replace and could feel vague if the pressures weren’t right. Racers didn’t adopt them and they were perceived as a beginner’s option. People just didn’t buy them.
These days, many in the industry are claiming 2.6in tyres are the new hot thing. They say they’re the best of both worlds: offering many of the benefits of plus, without as much sidewall-squirm and weight.
But is this in-between tyre size the goldilocks solution, or is fatter still faster?
To find out, I’ve extensively tested similar tyres in the three most relevant sizes: 2.3in, 2.6in and 2.8in. This involved over 100 timed runs over technical descents, as well as rolling-speed and climbing tests.
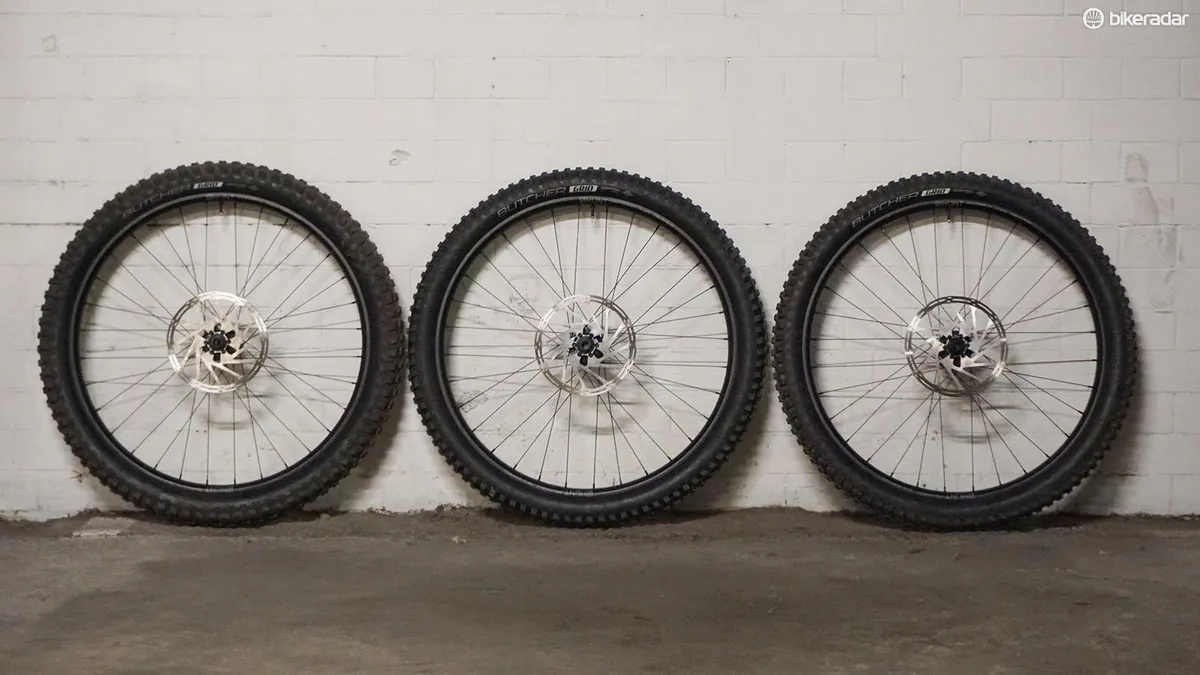
Seb tests 2.3in, 2.6in and 2.8in tyres tested against the clock to find out which is fastest
The equipment
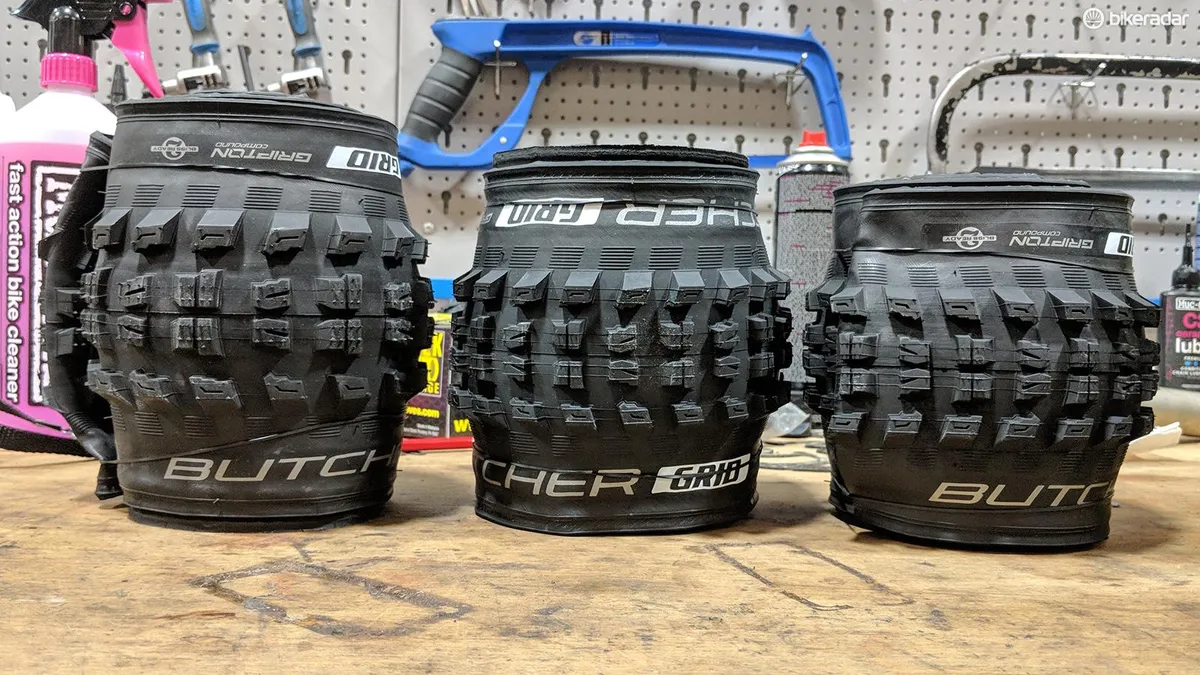
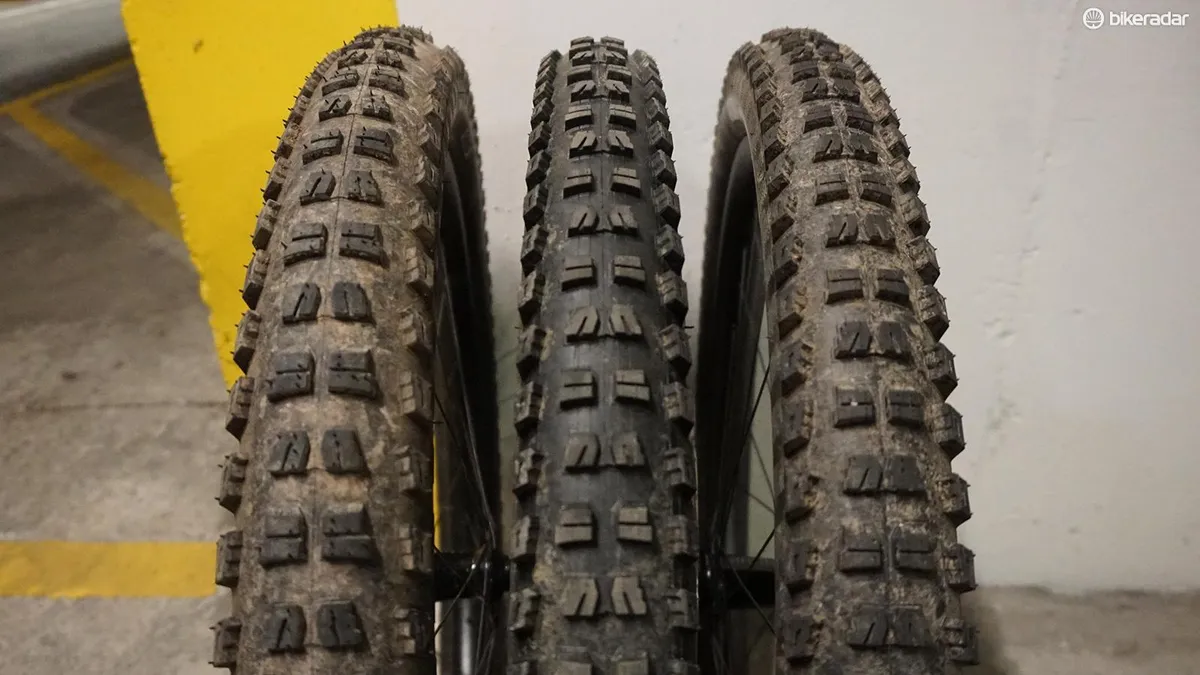
I chose Specialized Butcher Grid tyres for this test because they are available with comparable tread pattern, casing thickness and compound in all three sizes, making a fair comparison possible.
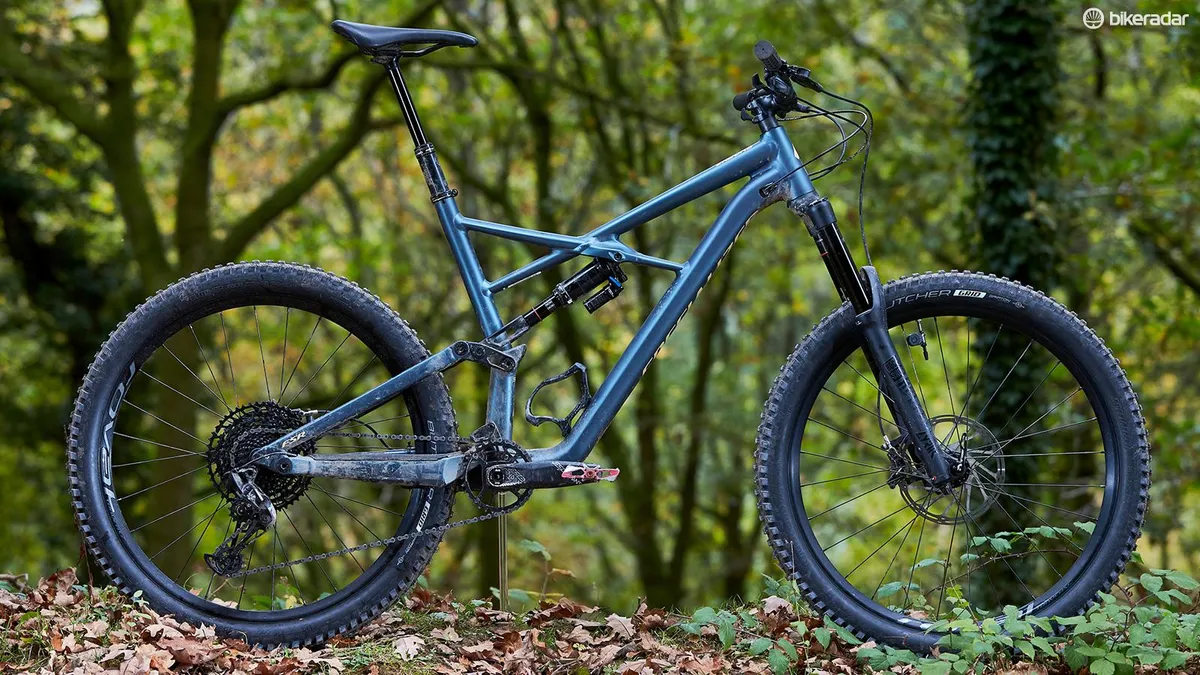
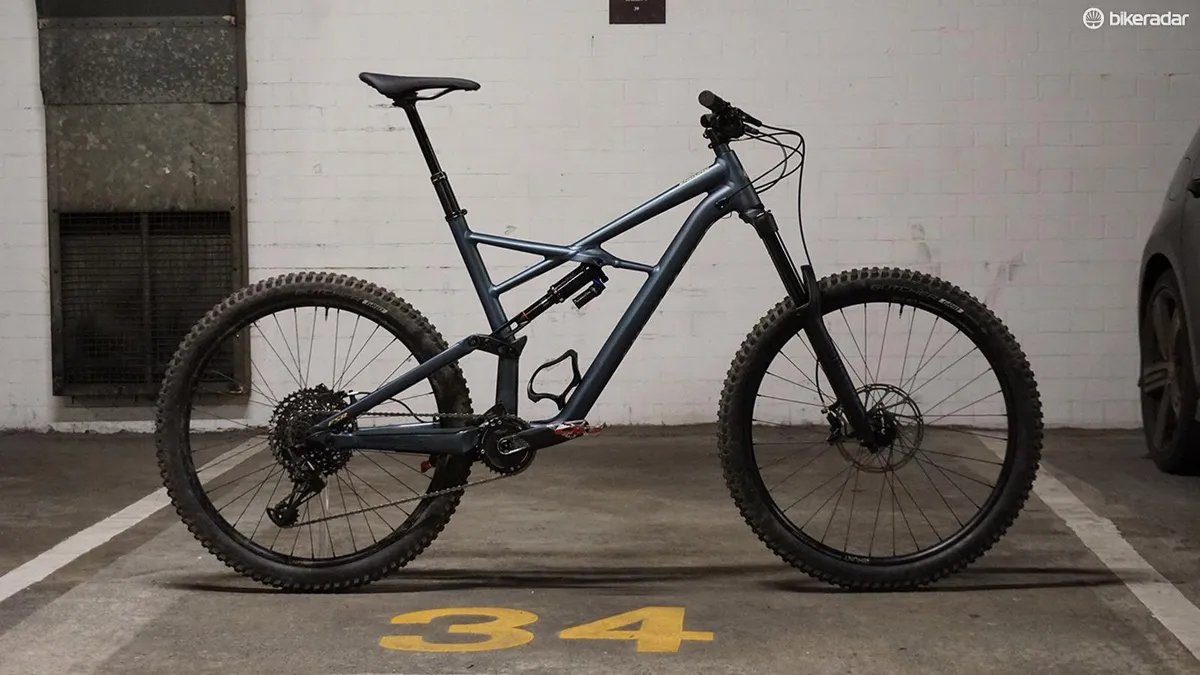
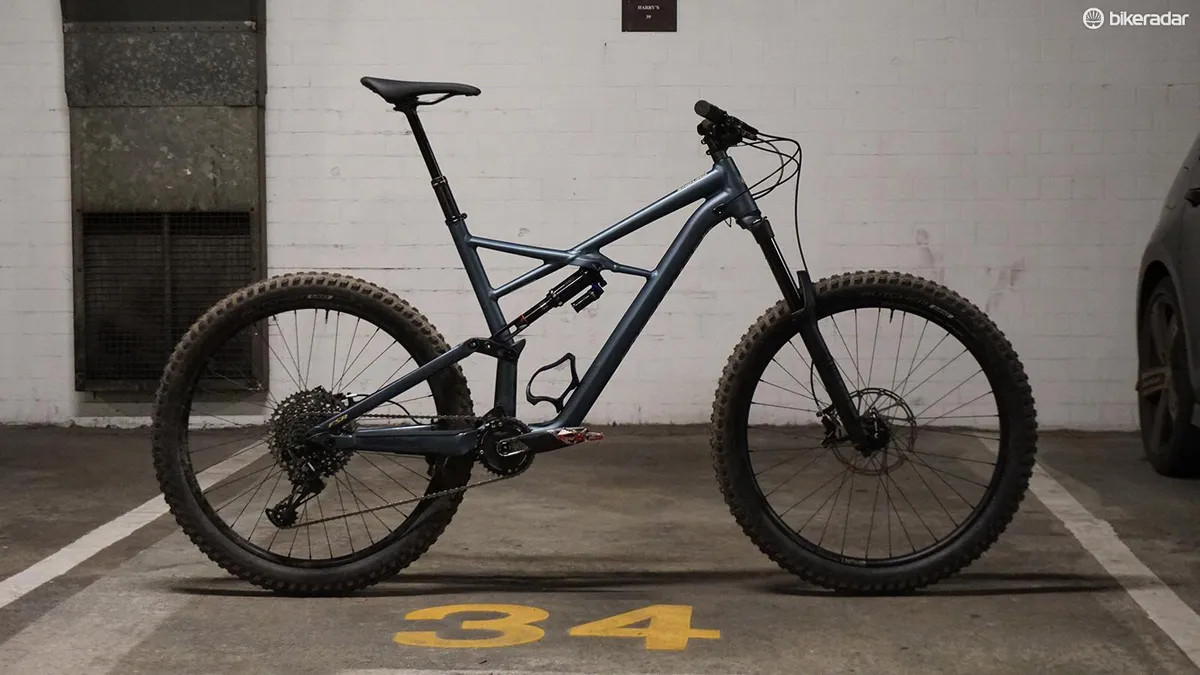
The tyres were tested on a Specialized Enduro Comp 27.5. This bike was chosen because it’s sold with 2.6in tyres, but has room for 2.8in rubber.
I used Hunt’s EnduroWide wheels. Their 33mm internal width is a good compromise for all the tyres tested; not too wide for the 2.3s, but not too narrow for the 2.8s.
There is logic to using wider rims for wider tyres, but this would introduce other variables such as wheel stiffness and wheel weight.
Hunt sponsored this test and provided three sets of wheels (one for each tyre size) so that tyres could be swapped quickly. Regular wheel swaps were key to testing the tyres fairly.
Finding the right tyre pressures
Tyres of different width will perform differently at the same pressure. That’s because a tyre supports the weight of the rider and resists deforming through the tension in the casing.
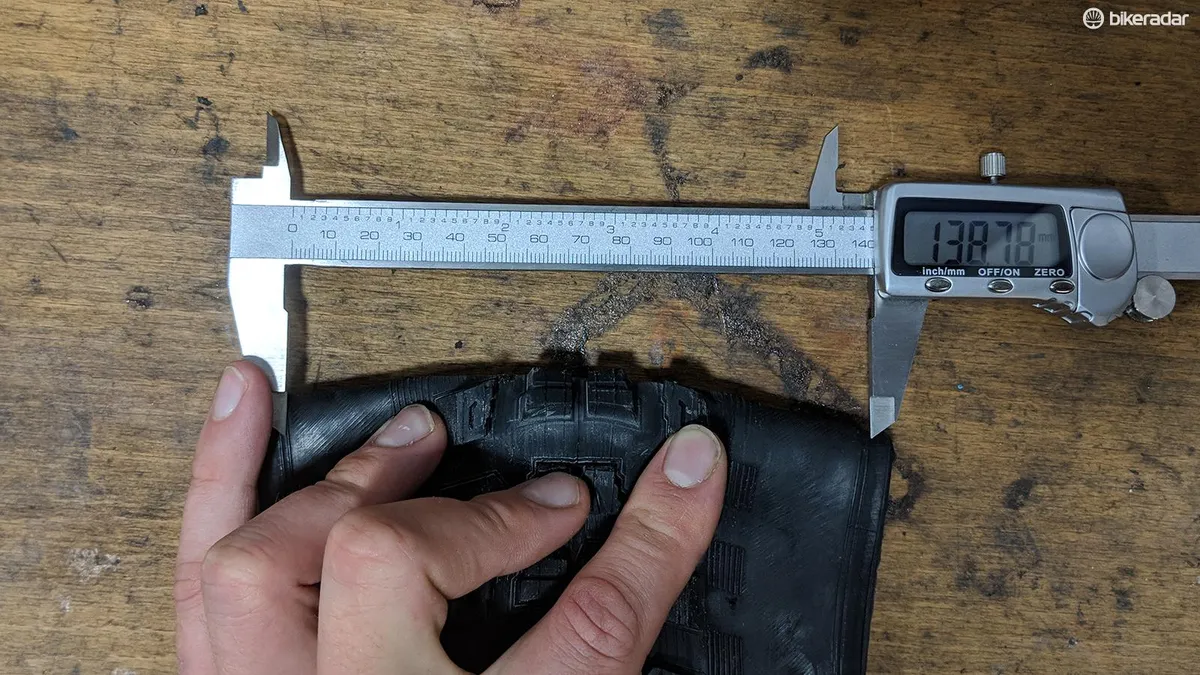
This tension is proportional to the pressure inside the tyre and to the circumference of a cross-section through the tyre. This circumference is the same as the total unfolded width of the tyre, from bead to bead, as shown below.
This relationship between pressure, circumference and casing tension is based on Laplace’s law, which is more often used to calculate the wall-tension in pressurised pipes or blood vessels.
The bead-to-bead measurements (which we’ll call the tyre’s circumference for ease, even though the tyre forms a C-shape rather than a full circle) of the tyres on test are shown below:
Bead to bead circumference vs tyre width
ArrayThe tyre pressure required to provide the same casing tension in each tyre is inversely proportional to the tyre’s circumference. So, if the tyre was twice as big, you’d need half as much pressure to get the same casing tension. This is why a fat bike tyre at 10psi holds the rider’s weight like a 23mm road tyre at 100psi.
For these tyres I calculated the pressure required in the 2.6in and 2.8in tyres, which would provide the same casing tension as my preferred pressures in the 2.3in tyres, which I determined to be 24psi in the front and 27psi in the rear. (These tyres have a relatively square tread pattern and flexible sidewall, so they need higher pressures to avoid the sidewalls collapsing.)
This was done by simply multiplying the pressure used in the 2.3in tyre by the ratio of the circumference of the 2.3in tyre over the circumference of the larger tyre.
This resulted in the pressures shown below:
Tyre pressure vs tyre width
ArrayTo check that this theory matched up to reality, I rode with these pressures on a wide range of terrain and found the tyres to have a similar feel in terms of sidewall stability and impact absorption.
I also rode a downhill track with 10 percent less pressure in each tyre. I felt they had similar amounts of sidewall-squirm in corners, but also felt the rims hit the ground in the same places each run. So it seems that this theory equates to a similar feel on the trail.
How big are the tyres really?
All tyres were installed on 33mm-wide rims and inflated to their maximum recommended pressures (to stretch the tyres to their full size) before being set to the riding pressures shown in the table above.
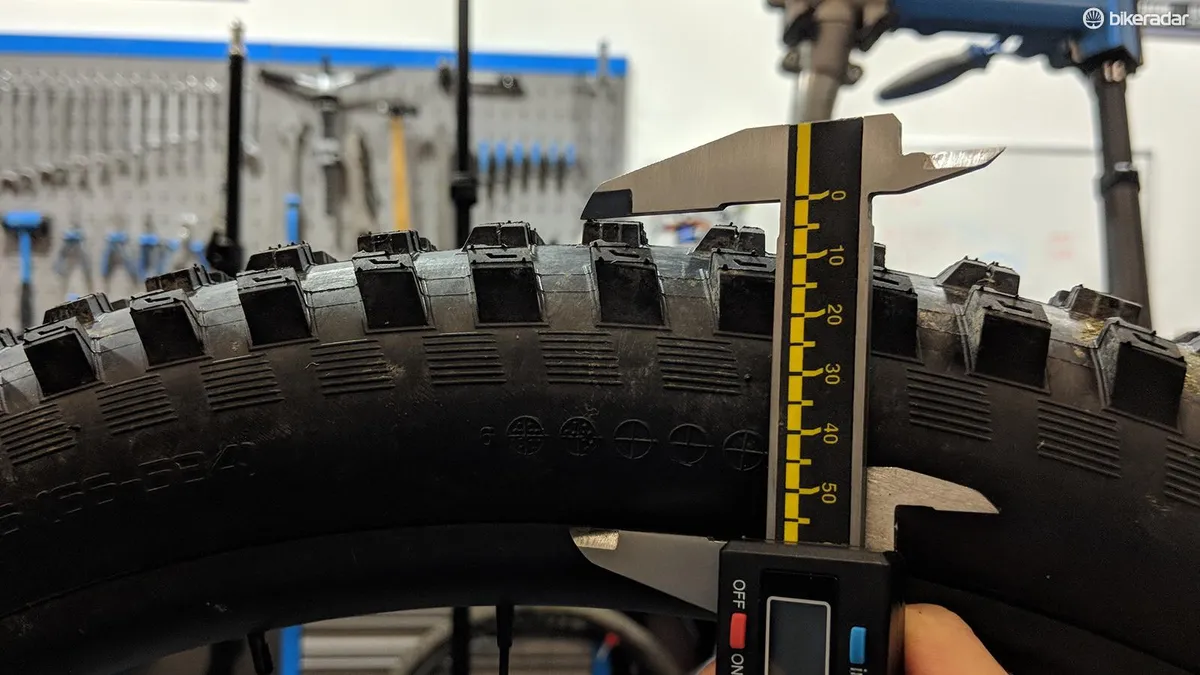
I then measured the tyres using a Vernier gauge across the full width of the tyre’s carcass. Interestingly, the small differences in pressure between the front and rear tyres make a measurable difference to the tyre width, as shown in the table below.
Quoted width vs actual width and depth
ArrayEqually important is the tyre depth — the vertical distance from the outside of the tread to the rim.
This is the amount of vertical movement the tyre can accommodate before the ground hits the rim. In this case, the vertical difference is notably similar between the 2.3in and 2.6in tyres.
The 2.3in tyres measure up at their stated width, while the 2.6in and 2.8in versions come up narrower than advertised — at least on this rim and these pressures.
So bear in mind that the tyres in this article are referred to by their quoted width, not their actual width.
By the way, it’s entirely typical for mountain bike tyres to measure up narrower than advertised. The recently-updated 2.3in Butcher is wider than its predecessor, and one of the few tyres which measure up close to its specified width at useable pressures.
In fact, many tyres claiming to be 2.5in wide measure up narrower than 2.3in.
How much do different size tyres weigh?
As you might expect, bigger tyres are heavier. But the extra sealant required for a bigger tyre adds an extra weight penalty.
It stands to reason that the amount of sealant inside the tyre should be proportional to the surface area of the tyre. The sealant volumes were calculated using the circumference measurements above, starting with 100ml of sealant per tyre in the 2.3in tyres, and scaling up to the bigger tyres in proportion to their circumference.
As sealant is water-based, 1ml of sealant weighs about 1g. From this we can work out the total weight of each tyre, including a proportionate volume of sealant, as shown in the table below.
Tyre and sealant weight
ArrayThe combined weight of the bike and rider in this case is about 102kg. The difference in weight between the pair of 2.3in and 2.8in tyres is 0.35 percent of the whole bike and rider system.
When it comes to climbing at a steady speed, this is the most important number. It’s the extra weight that needs to be lifted against gravity.
When it comes to acceleration, every extra gram on the outside of the wheel has roughly double the effect on acceleration as a gram on the frame. That’s because it needs to be accelerated both horizontally and rotationally.
So that 0.35 percent increase in total system weight will equate to roughly 0.7 percent slower acceleration under the same conditions.
How does tyre size affect geometry?
Fatter tyres raise the bottom bracket height, but not by as much as you might expect. The table below shows the bottom bracket (BB) height of the Specialized Enduro, measured with each tyre size fitted at riding pressures.
A change of 5mm across the range of tyres is noticeable when riding, but small enough that the tyres can reasonably be compared on the same bike without modifying the frame to preserve the geometry.
It’s worth noting that the 2019 Specialized Enduro 27.5 has a bottom bracket height roughly 12mm lower than claimed on Specialized’s geometry table with the stock 2.6in tyres fitted.
BB height vs tyre size
ArrayThe testing
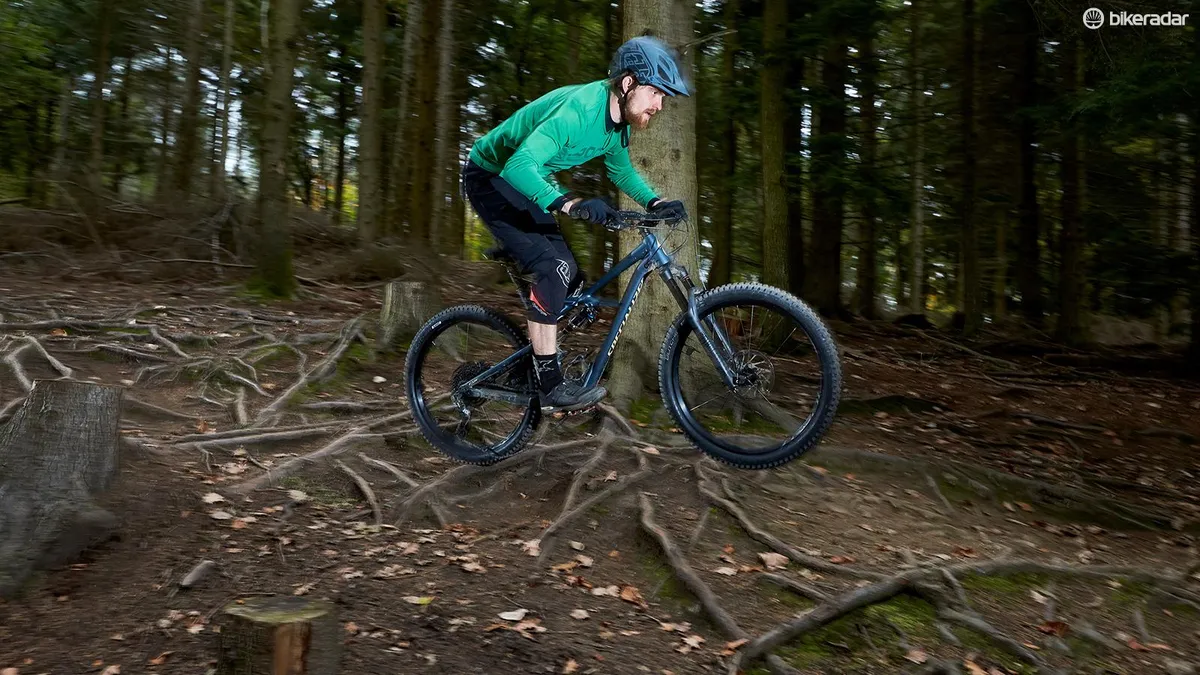
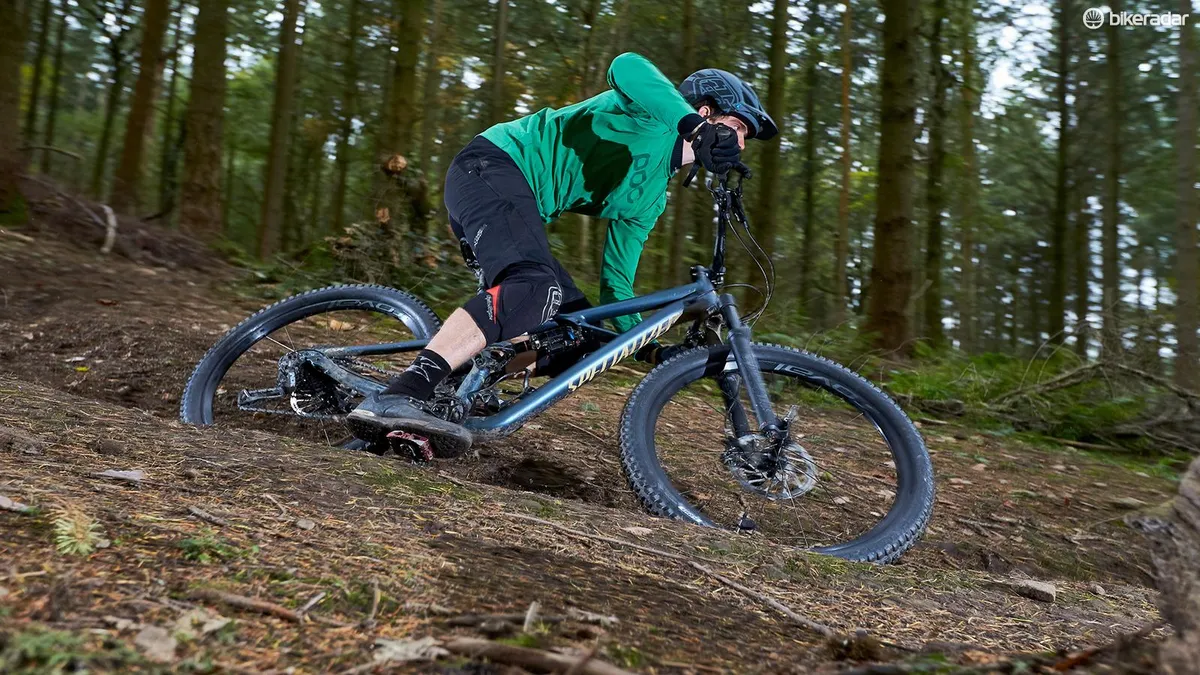
How does tyre size affect descending speed?
To see how the tyres compared on technical terrain, I tested them down three tracks against the clock.
The first was greasy and rooty, with tricky off-camber sections and tight, rutty turns. We’ll call this the rooty track.
The second was a longer downhill track, with a mix of flat turns, jumps, more roots, braking bumps and bumpy machine-built berms. We’ll call this the downhill track.
The third track was steeper and more natural, with a loose surface, small stones, roots and some tight turns. We’ll call this the steep track.
I completed between two and four timed runs on each tyre on each track = 36 runs in total.
I rode the tracks twice before timing started to familiarise myself with the tracks. The tyres were swapped between each timed run and the order they were tested was reversed after completing a run on each tyre. This was done to minimise the effect of becoming more familiar with the track.
The table below shows the average time for each tyre on each track, along with the percentage difference relative to the time set on the 2.3in tyres.
Technical descending
ArrayOn all three tracks the 2.3in tyres were, on average, the slowest, while the 2.8in tyres were the fastest.
Taking all of the times from all of the tracks together, the 2.6in tyres were on average 0.9 percent faster and the 2.8in tyres were 2.5 percent faster than the 2.3in tyres.
Is this result significant?
Just because there’s a difference in the average time with each tyre, that doesn’t mean there’s a meaningful (statistically significant) difference between the results for each tyre.
As an analogy, if you flip a coin ten times and get six heads, that doesn’t mean the coin is unfair, it could be just down to random variation. Similarly, a small difference in the average time may not be significant, particularly if there’s a large difference between the times posted with the same tyre.
To find out if there was a statistically significant difference in this case, I used a statistical test called a paired t-test. This compares times between two tyres for each run of each track and returns a p-value. This indicates the probability of getting such a result if the tyres had no effect on time, and the differences were just down to random variation. Generally, if the p-value is less than 5 percent, the result is considered statistically significant.
Looking at all these results, the difference between the 2.3in and 2.6in tyres was not statistically significant. Despite the 2.6in being faster on every track, there’s still a 7 percent chance of getting these times even if the tyres had no effect on speed. But when comparing the 2.8in to the 2.3in, or 2.8in to 2.6in, there is a statistically significant difference, with a p-value of 1 percent and 1.5 percent respectively.
This tells us that there is a real, systematic difference in the times I was posting with the 2.8in tyres relative to the other two. However, from these results we can’t confidently say the same about the difference between the 2.6in and the 2.3in tyres.
This testing was done by just one person, though, and on only three test tracks. Most importantly, this test was not blind. I knew which tyres I was riding and may have been influenced by my preconceptions about how they would perform.
Ride feel
More subjectively, the bike was calmer and smoother to ride with the 2.8in tyres fitted. I felt I had more grip too. The bigger tyres were consistently less prone to washing-out in flat turns.
I also made fewer mistakes with the bigger tyres. This is all while maintaining a higher average speed over all three test tracks.
On the other hand, the plus tyres did have a slightly odd 'bouncy' feeling, particularly when the rear tyre was unweighted due to hard braking. Here, the rear wheel was more unsettled over braking bumps.
The difference in feel between the 2.6in and 2.3in tyres was surprisingly minimal
This could be remedied to some extent by slowing down the shock’s rebound damping, and it wasn’t something I found off-putting even when jumping.
This un-damped bouncy feeling is more noticeable on bikes with less suspension travel. The Enduro’s 170mm of damped suspension absorbs and dissipates most of the bump’s energy. The relatively high tyre pressures used here also result in less bump energy being absorbed by the tyre and more by the suspension.
I tested the 2.8in tyres at harder pressures than many people would choose to run in a plus tyre. At these pressures, they didn’t feel any vaguer when cornering hard than with narrower tyres. This is not surprising given the casing tension was the same in all three tyres.
Despite these relatively high pressures, the 2.8s were still better able to absorb bumps in the trail and offered more traction in most conditions. In other words, you don’t need to run a plus tyre at very low pressures to gain an advantage.
The difference in feel between the 2.6in and 2.3in tyres was surprisingly minimal in this case, both in terms of traction or comfort.
How does tyre size affect rolling resistance?
We’ve seen that bigger tyres offer more grip, better comfort and allowed me to ride consistently faster on all three downhill test tracks. But does that grip come at a cost in terms of rolling speed?
To answer this question, I performed roll-down tests. These consisted of riding downhill on a slight gradient without pedalling or braking, and timing how long it takes to roll between two marker points. I set off just above the first marker at the same point every run, and adopted the same position (seated with straight arms).
I did six timed runs for each tyre size, so 18 in total. I did this on two surfaces: a smooth fire road and a rough track.
The rough track had a similar surface to a cobbled road, with large enough bumps to activate the suspension, but not so rough as to make riding seated uncomfortable.
Six timed runs were completed for each tyre size and the average time taken to complete the course is shown below, along with the percentage difference in time relative to the 2.3in tyres.
Roll down test: rough surface
ArrayIn this test, the 2.6in tyres were, on average, no faster or slower than the 2.3in tyres, but the 2.8in tyres were, on average, 4.2 percent quicker. This is a statistically significant difference (with a P-value of 2 percent)
The smooth fire-road was a typical gravel road, with few bumps big enough to overcome the friction in the fork.
Once again, six runs were completed for each tyre size. The table shows the average time taken to complete the course for each tyre, along with the percentage difference in time relative to the 2.3in tyres.
Roll down test: smooth surface
ArrayOn this surface, the 2.3in tyres were the slowest and the 2.6in the fastest. There was a statistically significant difference when comparing the times for the 2.3in to the 2.8in, or the 2.3in to the 2.6in tyres, but the difference between the 2.6in and 2.8in tyres was not statistically significant.
In other words, it’s unclear from these results whether the 2.8in tyres or 2.6in tyres were fastest on the smooth fire road, but they were both significantly faster than the 2.3in tyres.
Similarly, the 2.8in tyres were significantly faster over the rough track, but it’s unclear whether the 2.3in tyres or 2.6in tyres were the slowest on this surface.
Perhaps this is because the 2.8in tyres have around 4mm more vertical depth with which to absorb bumps than the 2.6in, while the difference in depth between the 2.6in and 2.3in is only around 1mm.
How does tyre size affect climbing speed?
To find out how the tyres compare when climbing, I once again tested on two surfaces: one rough, one smooth.
I used an SRM power meter to control my power output. I aimed to average 300w over the steeper, rougher course, and 250w over the smoother course, which was also much shallower in gradient.
The average power output for each run varied between 303w and 306w, with an average over all six runs of 304w
Because I could constantly monitor my average power output, I was able to get consistent average power numbers to within two or three watts each run.
Moreover, as both climbs were low speed — making air resistance negligible — the average speed was found to be proportional to the average power output.
To test this, I repeated the rough climb with the same tyres at 304w then at 416w. The average power was therefore 36.8 percent higher the second run, and the average speed was found to be 36.6 percent faster. This suggests that, to a good approximation, speed is indeed proportional to average power over this track, particularly for small differences in power.
Therefore, the average speed for each run could be scaled proportionally with the average power output. So, if the average power was 1 percent higher than the power I was aiming for, the time could be scaled up by 1 percent to estimate the time it would have taken without that 1 percent additional power.
On the rough track, the test was repeated twice on each tyre (six runs in total). The average power output for each run varied between 303w and 306w, with an average over all six runs of 304w.
Therefore, the times were scaled to determine the approximate time expected if all runs were done at an average power of 304w, then the average time over the two runs was calculated as shown below.
Rough climb
ArrayThe average time over two runs was 0.14 percent slower with the slowest tyre (2.8in) than with the fastest (2.3in).
There weren’t enough runs to make any statistically significant claims about these times, but the small differences between individual timed runs suggest that all three tyres were very similar in speed.
Interestingly, the difference in times was less (0.35 percent) than the difference in total system weight (of bike and rider) between the biggest and smallest tyres. This suggests that rolling resistance may have been lower with the larger tyres, but not by enough to offset the increase in weight.
Perhaps this track, which has a 12 percent average gradient, is simply too steep for rolling resistance to have much of an effect.
The same method was applied on the smooth fire-road, except the average power output was 253w and five runs were completed for each tyre size.
ArrayAs with the roll-down tests over this smoother fire-road, the 2.3in tyres were the slowest and the 2.6in the fastest. Once again, the statistics suggest that the 2.6in tyres and the 2.8in tyres are both significantly faster than the 2.3in tyres, but the difference between the 2.6in and 2.8in tyres was not statistically significant.
In other words, we can say with some confidence that the 2.3in tyres were the slowest, but there’s not enough evidence to say whether the 2.6in or 2.8in tyres were the fastest.
Conclusions
Just like in my 2.3in vs 3.0in tyre test, I found that bigger tyres offered a smoother ride, more grip and allowed me to ride faster over rough and technical terrain.
The difference in both ride feel and descending speed was more pronounced between the 2.6in and 2.8in than between the 2.3in and 2.6in tyres. This is perhaps because the difference in tyre depth (the vertical thickness of the tyre) between 2.3in and 2.6in was far smaller than that between 2.6in and 2.8in.
It’s worth pointing out that UK has been unusually dry this autumn, so I didn’t have a chance to test in muddy conditions, where the bigger tyres might not have fared so well. However, I did test in the mud in my previous tyre-size experiment and found the bigger tyres to be no better and no worse than their narrower counterparts.
When it came to rolling speed, the narrowest tyres were markedly the slowest on the smooth fire-road, both uphill and down. On the rougher surface, the 2.8in tyres were markedly faster than the other two when coasting downhill, but all three tyres were very similar in speed when climbing up the steeper, rough track.
In other words, there was no significant penalty to running the larger tyres when it came to rolling speed and climbing speed when riding off-road. In fact, aside from the steep climbing track, the 2.8in tyres were significantly faster than the 2.3in tyres everywhere.
This won’t be a surprise to those who have seen my 2.3in vs 3.0in tyre test, or Joe’s 2.0in vs 2.2in cross-country experiment. In both of those tests, the bigger tyres went faster on this same fire-road.
That’s not to say that big tyres are always faster. This test is focussed on off-road riding, but I carried out a brief roll-down test on tarmac and found the 2.8in tyres were significantly slower than the 2.3in tyres. In my 2.3in vs 3.0in test, I found the same thing: bigger mountain bike tyres are slower on the road.
Road riders are starting to realise that 25mm or 28mm tyres are faster than 23mm tyres even on the smoothest tarmac, but don’t expect to see 2.8in tyres on road bikes any time soon!
The rougher the terrain, the bigger the tyre that offers the least rolling resistance. That’s why the 2.8in was the fastest on our rough surface, the 2.6in was (sort of) the fastest on the fire road, and the 2.3in was the fastest on tarmac.
That’s because the fatter tyres (in the range of mountain bike tyres) have inherently more rolling resistance on smooth terrain, because there’s more material flexing in the carcass as they roll.
However, over rough terrain the bigger tyre absorbs more of the energy from bumps and transmits less of that energy to the suspension and the rider.
The tyre acts almost like an undamped spring, so it returns most of the bump’s energy after it rolls away from the bump and the tyre casing rebounds. Whereas the energy transmitted to the suspension or rider is almost entirely absorbed — very little is converted back into forward momentum.
Punctures can be a problem with plus-size tyres, particularly the thin casing, sub-900g ones, which were popular in the early days of plus. Thicker casings are uncommon in plus tyres, perhaps because they’d be too heavy to sell, but also because a thicker casing would severely increase rolling resistance.
I didn’t suffer any punctures during this test, though, and I have had success using 2.8in Maxxis Minion tyres with inserts in rocky terrain, including racing. With the right pressures, plus tyres are, in my experience, not as puncture-prone as some have claimed.
What’s the bottom line?
All the testing I’ve carried out suggests bigger is usually better when it comes to riding fast off-road.
2.6in is not the “best-of-both-worlds” as some have claimed, but is a compromise, offering some benefit over a 2.3in but not as much as a 2.8in tyre.
However, not everyone will like the bouncier, more isolated feeling that a true plus tyre can provide. So something in-between may be a good option for some riders.