This is a sponsored article in association with Zwift..
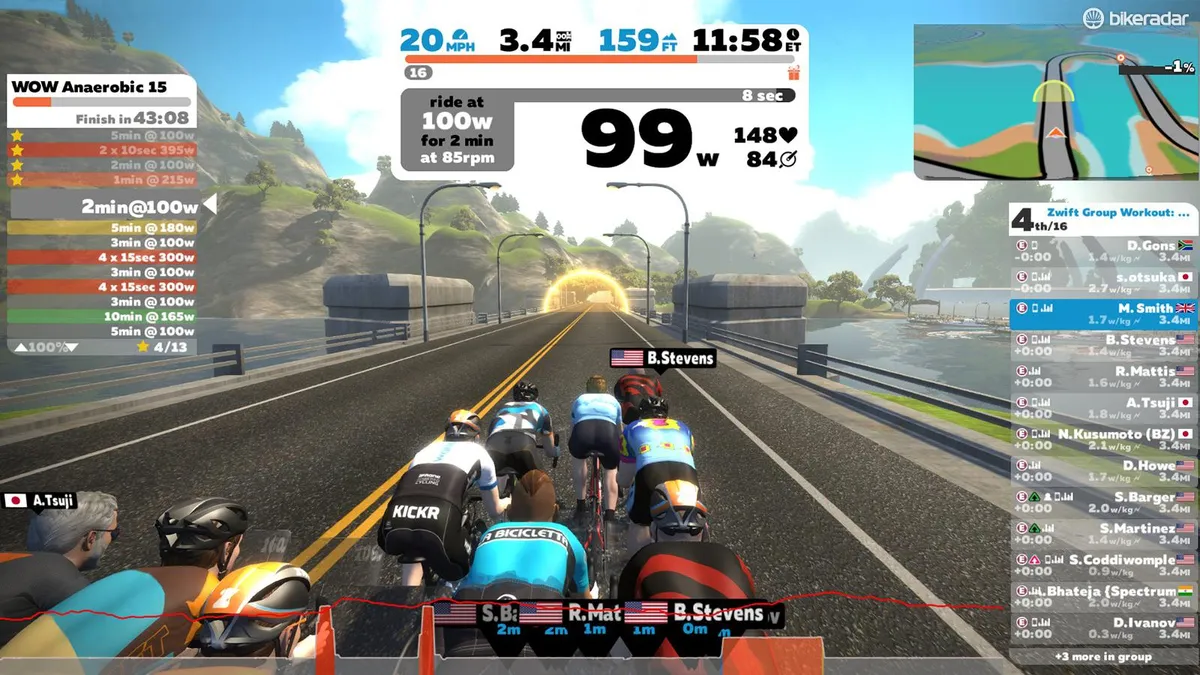
When you finish Zwifting, a summary of your effort and experience — called the Ride Report — pops up on your screen. The analysis tells you where and how hard you rode, who joined you, the amount of energy you used and more.
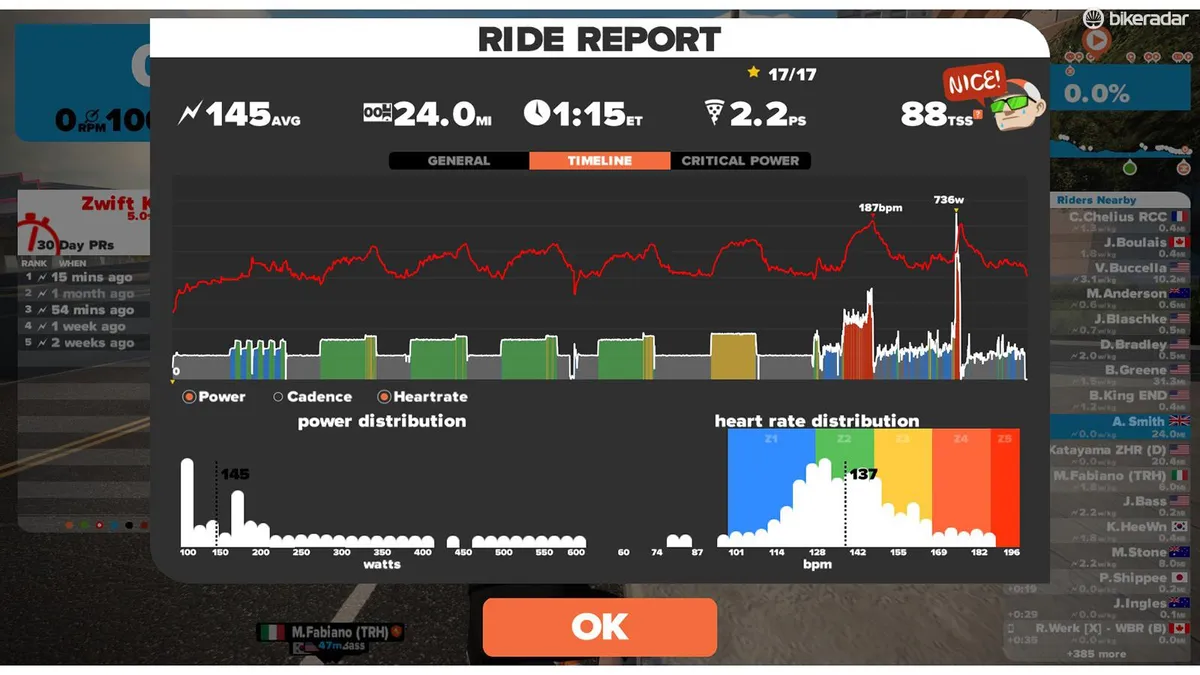
The Ride Report starts with all the essentials: average power expended (in watts), elapsed time and total distance appear across the top of the report’s opening window.
The number of calories you’ve burned is visible too — in pizza slices (PS). Every PS is worth 285 calories, and you can scan your report to see where you rode and who gave you ‘Ride Ons’.
The timeline window shows performance stats, charting your entire effort via power, as well as optional heart rate and cadence data. It’s a great way to visualise your steady spinning, spiked efforts and stretches of recovery.
Critical Power compares your last completed ride against your best efforts on Zwift. As you get stronger, you’ll notice how the graph reflects your ability to generate more power for longer.
And finally, your TSS score is a measure of training stress that takes exercise metrics, including intensity and duration, and then quantifies the difficulty of the workout.
When you ride all-out for an hour you can score an impressive 100 TSS. So what are you waiting for? Start pedalling!