2020 has been a pretty rough year for many of us, but I have to say I've been very fortunate.
Not only have I managed to stay healthy and keep doing one of the best jobs in the world – testing bikes and letting you know exactly what I think of them – but I've also become a dad.
As if that wasn't enough, this has been a stellar year if you're a suspension nerd (which I am).
- See all of the BikeRadar team's Gear of the Year for 2020
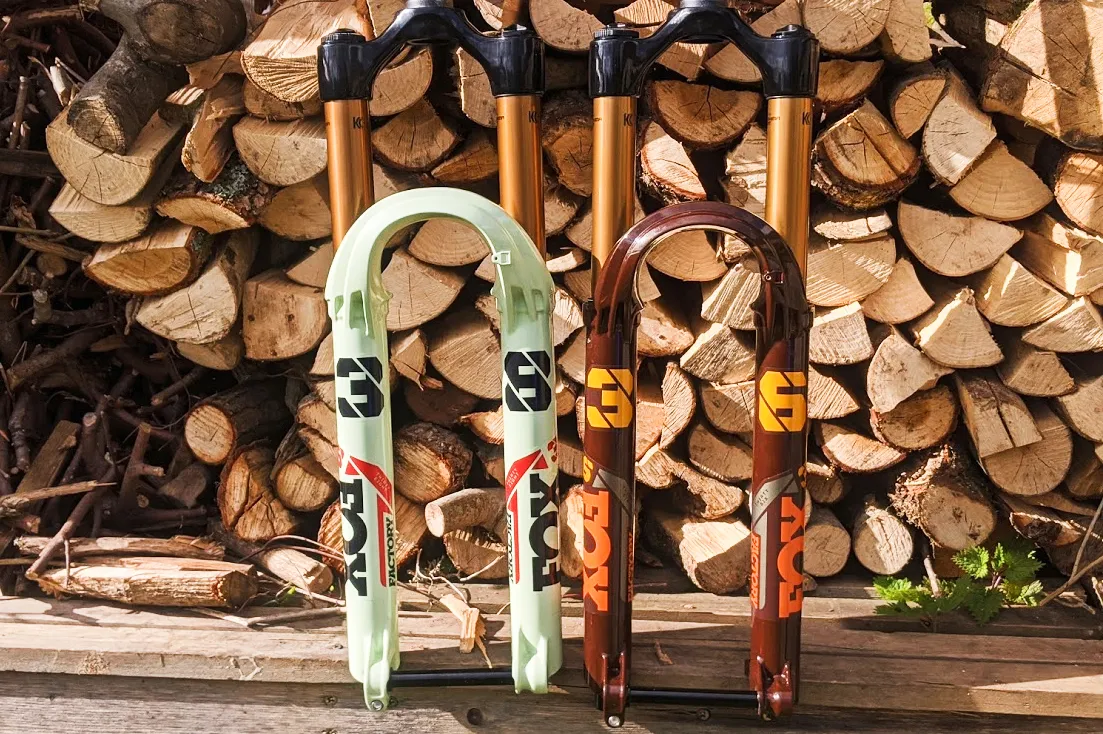
Fox 38 and 36 forks

- 36: £1,159 / €1,459 / $1,099
- 38: £1,299 / €1,589 / $1,199
It wasn't a huge surprise when Fox launched the 38 back in April – we'd seen it on race bikes before this. We didn't anticipate that Fox also made some serious updates to the 36, including the chassis, air spring and damper.
Shortly after this, RockShox launched the Zeb to rival the 38: another big-hitting "SuperEnduro" fork with 38mm stanchions. I immediately set about testing them in order to find out which is best. You can read all about the test here.
(Spoiler alert – the 38 is best.)
In short, it provides excellent beginning-stroke sensitivity for a ground-hugging feel, yet has plenty of support when hauling on the brakes and deals with big hits without fuss.
After this head-to-head, I set about comparing eight enduro forks, riding them back-to-back on a range of rocky terrain. In this test, I learned the Zeb and 38 both handle large holes and square-edge bumps a little better than their skinnier-legged counterparts (the Lyrik and 36, respectively), with no discernible downsides aside from the weight.
Despite this, the 36 is nearly as good as the 38, with a similarly ground-hugging yet supportive feel. If you're more concerned about weight and cost, the new 36 is a fantastic fork. It's a big step up from last year's model and it's leapfrogged the RockShox Lyrik (the previous benchmark) in performance terms.
Privateer 161
- £1,489 (frame only)

I've been using the Privateer 161 as a long-term test bike this year, which means I've put a lot of time on it testing forks, tyres and wheels.
With a wheelbase of 1,330mm, it's one of the few bikes that fits me really well. This means I can throw my weight around and charge into rough sections or steep turns without worrying about the bike tripping up.
Meanwhile, the efficient suspension and steep seat-angle make it a doddle to winch up the nastiest climbs. Yes, it's pretty heavy (with burly parts, mine is sitting around 16kg), but that's more than offset on steep climbs by the riding position.
There was also some creaking from the shock to begin with, but this has been sorted by replacing the shock bushings.

Motion Instruments data acquisition system

- $1,049.99 (currently $799.99)
This data acquisition system is one of the first that could be bought and understood by a (keen) non-pro racer. Although it's been developed with pro-level athletes, such as Greg Minnaar, it could just about be described as affordable if you're the type of person who travels the world in search of downhill or enduro glory.
It's also the most user-friendly data acquisition system we’ve seen so far, which is handy given that not all up-and-coming downhill racers are also talented data analysts.
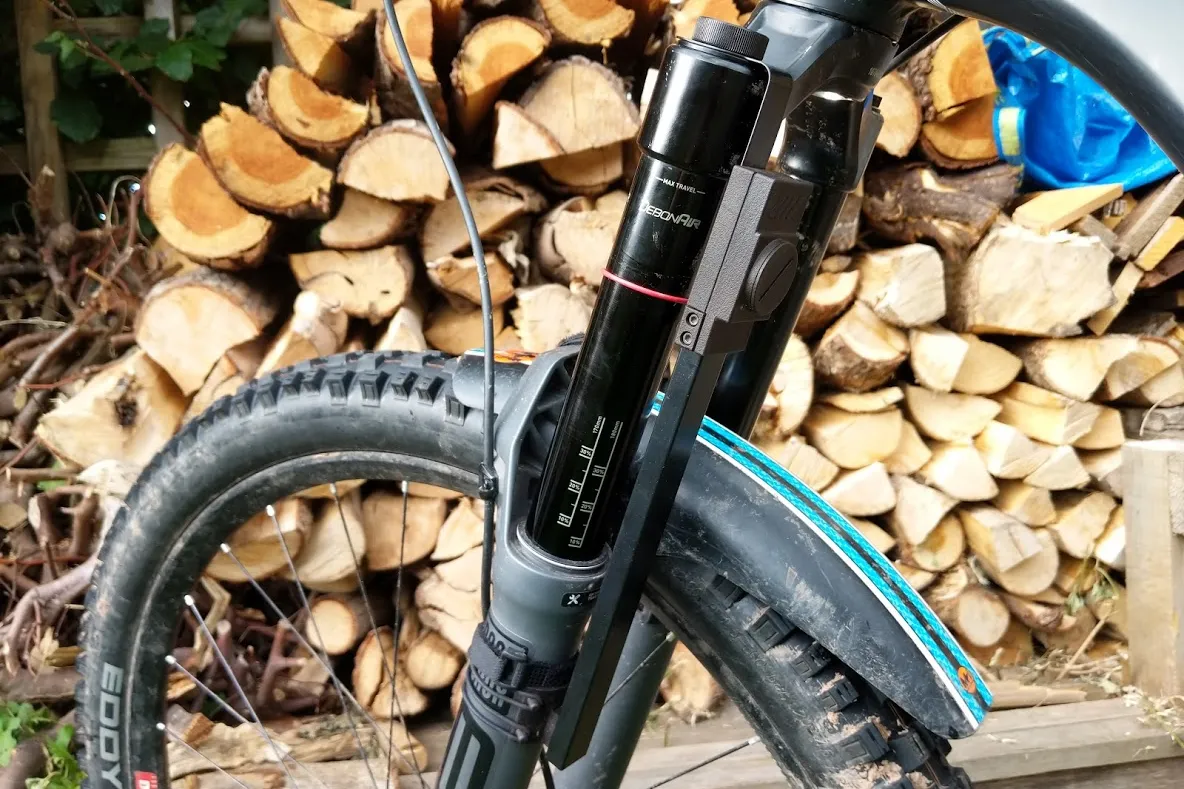
The kit consists of a pair of sensors, one for the fork and one for the shock, which measure (200 times a second) where the suspension units are in their travel. They send this data to your smartphone via Bluetooth, leveraging the awesome computing power in your pocket to analyse the data.
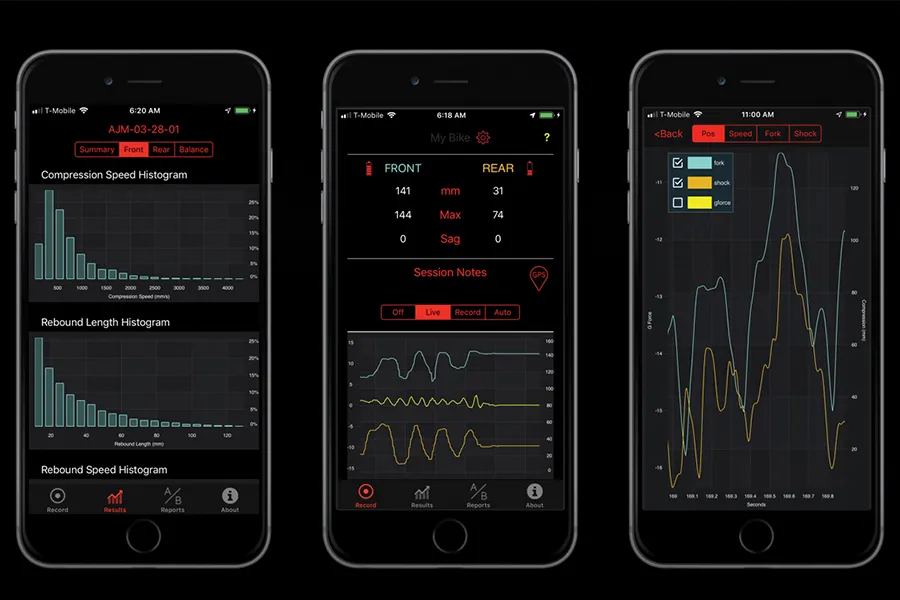
The Motion IQ app then allows you to make sense of it with charts and graphs, which can tell you how much travel you're using, how balanced your suspension is, how fast it's moving, how much vibration it's transmitting and much more.

It doesn't make specific setup recommendations, but makes it easy to see if your fork and shock are working in tandem; if you're using an appropriate amount of travel, and if your suspension is moving at an appropriate speed. Motion supplies thorough explanations of suspension theory and what each graph means, with examples to help point you in the right direction.
Interestingly, Motion's engineers say they've learned that suspension rebound should be set pretty fast in order to work at its best. In fact, they say most riders end up setting their rebound faster after testing with the kit, and suggest many forks and shocks are simply over-damped.
I've been using the kit to analyse how the Fox 38 and RockShox Zeb (see above) perform on the trail. It provided valuable insight to the test, as well as making me reconsider my suspension setup more broadly.
I've always favoured fast rebound based on feel and timed testing, but the app made me realise my fork is considerably faster than my shock. Similarly, I learned my fork is often stiffer than it needs to be – it was surprising how little time it spends in the bottom half of the travel.
Whether that means I need to soften my fork and speed up my shock is another matter, but at least my eyes are open to what my suspension is doing and I know what to try next.
I've only scratched the surface of what's possible to learn with this kit, so I'm hoping Motion will let me hang onto it for a lot longer.
Our World in Data

- Free
While not an item of gear, or anything to do with cycling, I was impressed and heartened by the data communication website Our World in Data while researching for an article about the environmental impact of cycling. (Why not grab a brew and have a read – go on, it's Christmas!)
In an infodemic era of rampant conspiracy theories, echo chambers and misinformation spread on social media, Our World In Data clearly cuts through the noise to reveal the important long-term trends, clearly displayed and explained in its illuminating charts and articles.
Many of them reveal a world that's not as scary or confusing as your newsfeed would have you believe. Take this one, which I used in the aforementioned article (have you read it yet?).

Did you know the UK's greenhouse gas emissions (including those embodied in the goods we import from overseas) fell by 24 percent between 2007 and 2017? Because I didn't.
Isn't that something we should all know about?
Or how about this one on the long-term decline of working hours.

It's not all good news, of course. The site has plenty of articles about the growing problems of climate change, Covid-19 and other more worrying trends. But sometimes taking a look at the long-term data can be more informative, and often less alarming, than the stories in your news feed.
