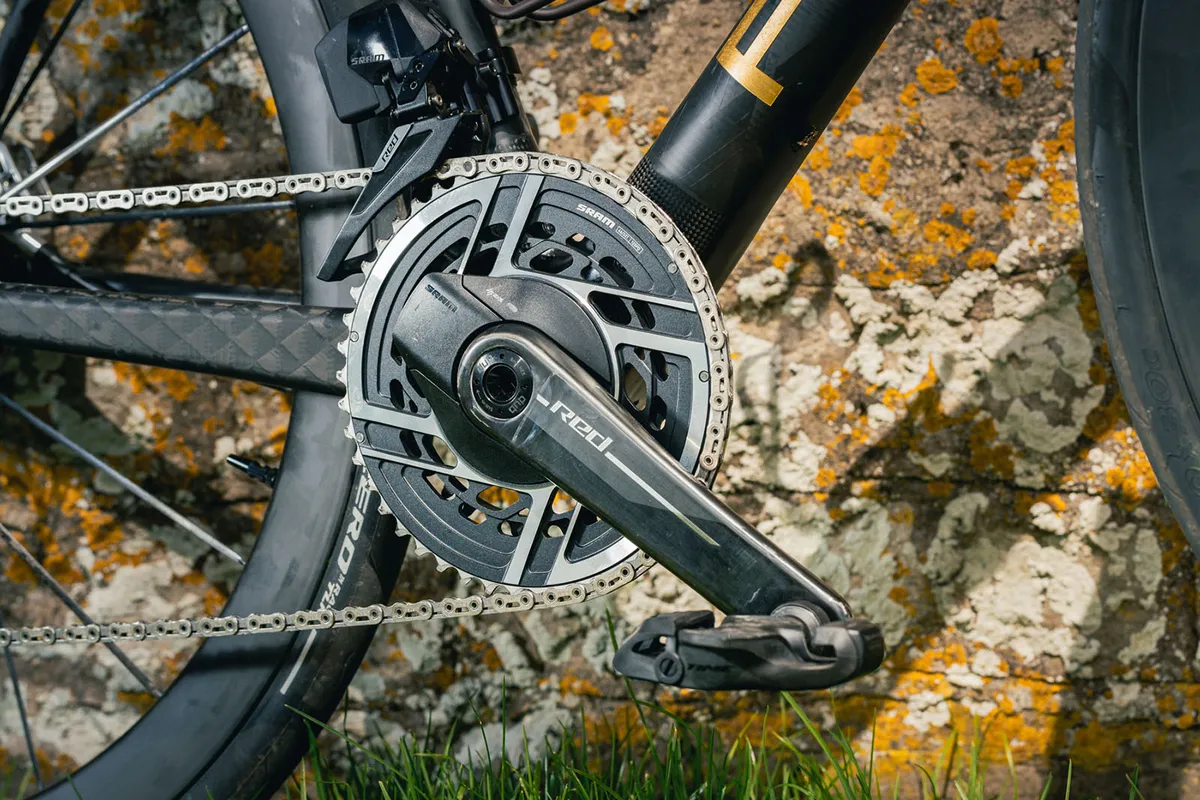
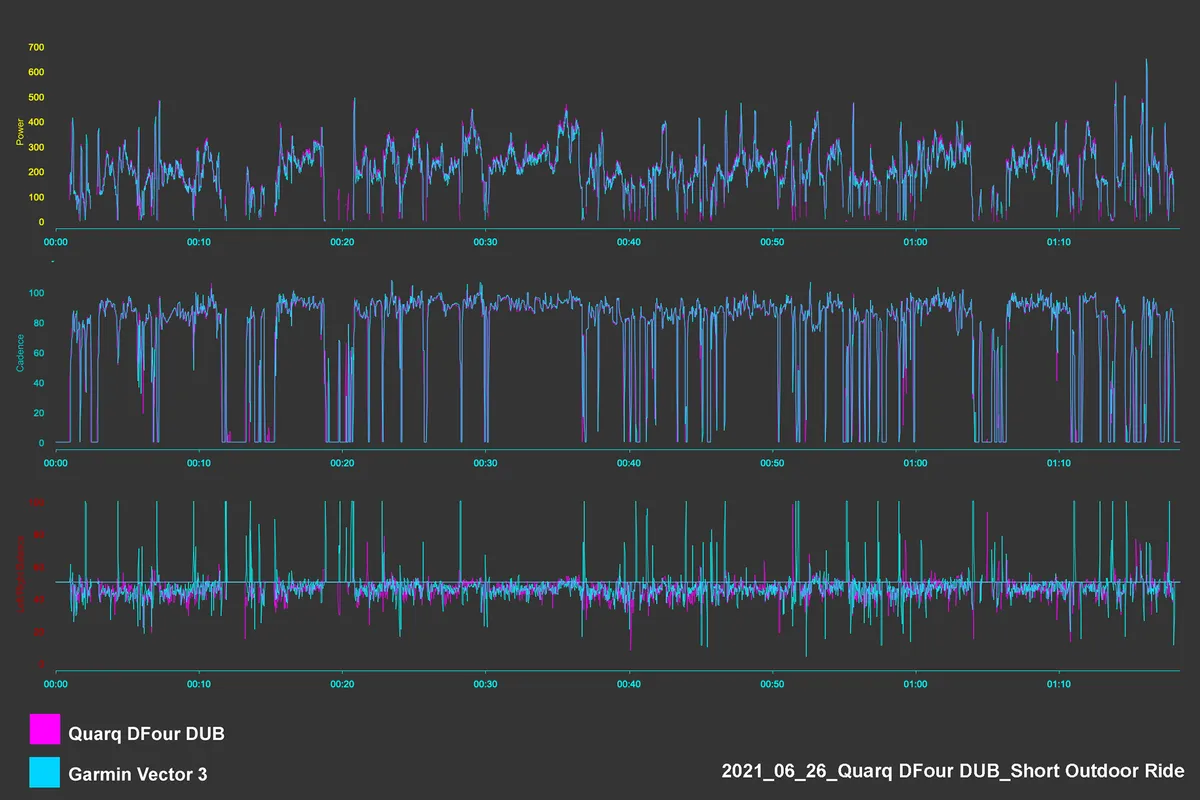
The ability to train with power sets cycling apart from a lot of other endurance sports.
If you’re lucky enough to have a power meter aboard your bike, or you use a smart trainer with a built-in power meter, you have access to one of the best tools for measuring your fitness and tracking your progress.
Owning a power meter is only half the battle, though. It can be tricky to know how to get the most from training with power when you start out. You have a wealth of data at your disposal, new training terminology to dissect and analysis software to navigate.
With that in mind, we’ll cover some of the main ways you can use a power meter to make your training more time-efficient and effective.
We'll also look at training intensity zones, explain the terminology so you can analyse your data and show some of the limitations to training with power.
We've broken it down into the following sections:
- What is power?
- Five ways to train with a power meter
- Training intensity zones
- Power meter terminology for analysing your data
- Limitations of training with power
What is power?

Power (measured in watts) is a combination of the force (or strictly speaking ‘torque’) applied through the pedals and cadence.
Your wattage is an objective measure of your external training load, i.e. it tells you how much work you’re applying to the pedals each second and the mechanical energy you’re generating in the real world.
Power vs heart rate
Power differs from heart rate, which measures internal training load, or in this case how hard your cardiovascular system is working. Both are valuable training metrics, but they measure different things.
Power is precise and fast to respond in comparison to heart rate. Due to the delay associated with heart-rate response, short, high-intensity efforts often only elicit a relatively small change in heart rate, despite the workload being comparatively high.
As a result, using heart rate can often under-estimate the strain of a given training session. A power meter can help you capture more detail about your ride.
Five ways to train with a power meter
Having the ability to measure your power output offers several major benefits for a focused cyclist who wants to train with data.
1. Plan and perform workouts

By using different combinations of training intensities and manipulating the duration of both the work and rest intervals in your workouts, it’s possible to stimulate the specific changes in your fitness needed to achieve your goals.
These goals might include improving your endurance on rides lasting several hours, increasing your VO2 max or boosting your threshold power. Using a power meter will enable you to target the specific intensity required to fast-track your fitness in a particular area.
Power-based training is most often prescribed as a percentage of your threshold power, where Functional Threshold Power (FTP) and Critical Power (CP) are often used to determine this threshold.
Both broadly represent the maximum power that can be sustained for an extended duration – typically between 30 and 60 minutes. Above this threshold, fatigue accumulates much more quickly than below.
Whether you want to create your own training plan, work with a cycling coach or use one of the many indoor cycling apps and training software packages, a power meter can help you get the most out of your sessions.
2. Assess strengths and limiters

Power data can be used to understand the durations and intensities where you are stronger or weaker. This indicates the types of riding you might be suited to, and where to focus your training to improve your limiters.
To determine this for yourself, try performing several maximal efforts over a range of shorter and longer durations (e.g. five seconds, one minute, five minutes and 20 minutes).
From here, there are many power profile tables and other resources available online to help you gauge what type of cycling you’re physiologically suited to.
You can then also develop a training plan to target any weaknesses. Or, you can focus on the areas that will make a difference in your chosen discipline, be it hill-climb racing, criteriums, cross-country mountain bike racing, cyclocross racing or sportive riding.
3. Track progress

Power can also be used to assess how well you’re responding to your training programme.
This could be through formal fitness testing to track improvements in the maximum power you can hold over a certain duration. Or, it can reveal improvements in your regular training sessions.
For example, you might see an increase in the power you can hold in a particular interval workout, or maybe observe a lower heart rate for a given power output.
4. Pace efforts

When it comes to competitive situations, power can be very useful in helping you pace your effort better.
It’s very easy to go out too hard in the early stages of a time trial, sportive or HIIT workout, since it takes time for your effort perception to catch up with the workload.
And although power meters are less common on gravel bikes than road bikes, a power meter could benefit your pacing strategy in gravel racing, too.
Power data tells you objectively how hard you’re working, removing external influencing factors that can affect heart rate (for example, sleep, caffeine intake and altitude). Therefore, you can back off when you see that you’re going over your limit.
5. Monitor fatigue

Arguably, one of the best ways to use power is in conjunction with a heart rate monitor and your subjective feelings on the bike.
Over time, you should get a good sense of what data is ‘normal’ for you. Deviations from the ‘norm’ can indicate that you might be overtraining, or even in the early stages of illness. This can signal the need to reduce training for a few days to enable your body to recover.
Common signs of fatigue and/or illness include:
- Heart rate higher/lower than normal for a given power output
- Delay in the time taken for your heart rate to rise in response to a set high-power effort
- A faster or slower time taken for your heart rate to fall after completing an effort
- A higher perceived effort level (often referred to as ‘rating of perceived effort’ or RPE) for a given power output
Training intensity zones

A helpful method of planning power-based training sessions is to use training zones.
Each zone relates to a small number of target physiological adaptations or training goals. Zone 1 allows for faster recovery, zone 2 develops aerobic fitness and endurance, and zone 5 builds your VO2 max.
There’s a good deal of overlap between the training zones. But using training intensity zones offers a useful starting point for planning and analysing your training. You can then better target the fitness changes you want to see.
Training intensity zones are generally based on FTP or Critical Power. You can determine these by performing one or more maximal effort tests and applying the appropriate calculations.
| Zone | Name | Heart rate (% of threshold HR) | Power (% of threshold power) | Typical duration |
|---|---|---|---|---|
| 1 | Active recovery | Less than 68% | Less than 55% | n/a |
| 2 | Endurance | 69-83% | 56-75% | 3+ hours |
| 3 | Tempo / Sweetspot | 84-94% | 76-90% | 20 mins to 1 hour |
| 4 | Threshold | 95-105% | 91-105% | 10 to 30 mins |
| 5 | VO2 max | More than 106% | 106-120% | 3 to 8 mins |
| 6 | Anaerobic capacity | n/a | More than 121% | 30 seconds to 3 mins |
Power meter terminology for analysing your data

Lots of metrics can be calculated and tracked with a power meter, and deciphering each can be overwhelming for a newcomer.
A number of software packages and cycling apps are available for analysing power data, including TrainingPeaks and Golden Cheetah. Strava also offers a more limited set of analysis tools.
Here are seven key metrics you’ll want to look at when analysing your data.
1. Average Power
What is average power?
This is an average of the power output produced during a ride or selected portion of a ride (e.g. an interval).
How to use average power
Average power is perhaps the simplest metric to look at to quickly understand how much work you did in a ride (or within an interval). You can see how this lines up with what was expected or targeted.
2. Normalized Power
What is Normalized Power?

In a ride with variable power output, Normalized Power is the power output that you could have achieved for a similar metabolic cost if riding at a consistent effort.
TrainingPeaks developed the idea of Normalized Power. Other training apps use similar metrics. Strava's equivalent is Weighted Average Power.
How to use Normalized Power
Normalized Power is particularly useful when a ride or interval features large fluctuations in power output. It can better represent the true difficulty of a ride or effort.
Here’s a simple example. It is more taxing to ride for one hour, alternating between 30 seconds at 300 watts and 30 seconds at 200 watts than it is to ride consistently for the same duration at 250 watts.
This is due to a number of factors, but relates mostly to the different energy systems used to produce power rapidly versus steadily – the former has a disproportionately higher energy ‘cost’ than the latter.
That's why a ride with repeated surges or high-intensity intervals will be harder than a steady-state ride, even if both have the same overall average power.
As a result, for a given ride, Normalized Power is a rough estimate as to the consistent power output you could have ridden at for the same metabolic cost. This is particularly useful for analysing the effort of rides with repeated surges or lulls in activity and is often used to compare performance against FTP.
3. Work
What is work?
The mechanical work produced by pedalling a bike, measured in kilojoules (kJ).
How to use work
Calculating the amount of work done during a ride makes it very easy to estimate the caloric expenditure. The amount of kJ produced when cycling is roughly equivalent to the number of calories burned, due to the mechanical efficiency of the human body.
This is great for cyclists looking to improve their body composition and match their carbohydrate intake to the demands of training.
4. Training Stress Score

What is Training Stress Score?
Another term developed by TrainingPeaks, Training Stress Score is a measure of the total training stress accrued in a training session. Training Load is Strava's equivalent metric.
How to use Training Stress Score
TSS depends on both the intensity (or Intensity Factor, as we’ll come on to) and the duration of the ride. A TSS of 100 would represent riding at your FTP for one hour, whereas a TSS of around 15 to 30 would represent a gentle 30 to 60-minute recovery ride.
You can use TSS to understand the training stress of a single session or the accrued training stress of multiple sessions within a training block and its impact on your performance. In turn, this can help avoid overtraining.
5. Intensity Factor

What is Intensity Factor?
Intensity Factor is the ratio of your Normalized Power to your FTP. For example, an IF of 0.8 suggests your Normalized Power was 80 per cent of your FTP.
Again, this is a term TrainingPeaks uses. Strava uses Intensity to the same effect, looking at your Weighted Average Power for a ride and presenting it as a percentage of your FTP.
How to use Intensity Factor
Intensity Factor provides a quick and consistent way of understanding the intensity of a particular training session, compared to your current level of fitness.
Intensity Factor can also be used to gauge improvements in FTP – for example, if you produce an IF of 1.05 or greater during a ride or race of around one hour in duration.
6. Watts per kilo (w/kg)

What is watts per kilo?
The power produced relative to your body weight.
How to use watts per kilo
When climbing, it's better to use your watts per kilo (w/kg) or power-to-weight ratio than average or Normalized Power alone. The greater influence of gravity means bodyweight plays a much greater role in your speed and performance when riding uphill.
7. Efficiency Factor
Efficiency Factor measures the relationship between power and heart rate through a ride or a section of a ride.
To calculate Efficiency Factor, TrainingPeaks software divides Normalized Power by average heart rate to produce a ratio. The higher the number, the better.
How to use Efficiency Factor
Over time, Efficiency Factor can indicate how your power output is changing at a given input (of heart rate). This is useful during base training as a proxy for your aerobic fitness.
Let's say that at the start of your winter training plan, your Efficiency Factor for an endurance ride is 1.6. Later in the plan, your Efficiency Factor has risen to 1.8 for a comparable ride. That means you can produce more watts for the same input and have become fitter.
Limitations of training with power

While training with a power meter is undoubtedly an effective tool for cyclists, there are some limitations to be aware of.
Cost aside, one of the biggest limitations of training with power is the difficulty in determining accurate training intensities on an individual basis.
FTP can be overestimated by some of the common testing protocols used. What's more, training zones are based on population averages. So even if your FTP is set accurately, the standard zones may not always be exactly right for you.

Therefore, it’s important to pay attention to heart rate and perceived effort, in combination with your power data, to iterate your training to suit you.
There’s also day-to-day variation in the power you can achieve, which you'll need to account for when planning and analysing power data. It’s helpful to have a wattage ‘range’ in mind for a particular training session, rather than a single power number.
Power meters also produce a lot of data. You can easily get bogged down in the numbers when you go to analyse them.

It’s important to keep the bigger picture in mind and make judgments on whether you’re improving overall. Don't just focus on the power output you can sustain for a single effort duration.
Finally, power data can’t always accurately capture the true strain of a particular ride. Factors such as heat, dehydration and under-fuelling can all increase the fatigue accrued from a session.
Ultimately, the most valuable way to use power data is in combination with both heart rate and RPE. This combination enables you to see more of the picture and strengthen the conclusions you can draw from the data generated by a power meter.


